
Punch line: YTD the SPX-Euro relationship on average appears quite random. However, this aggregated data belies the forceful regime behaviour (traditional FX, with SPX and Euro +ve/-ve in tandem, vs. US centric, with SPX +ve/-ve while Euro –ve/+ve) that has frequently prevailed, in the ST, within this YTD horizon. In an attempt to discern any convincing industry themes, agnostic to SPX-Euro regime behaviour, I drilled down to the 3 most +ve and –ve episodic 10d correlation (traditional FX and US centric) sub-horizons and associated industry intersection at correlation extremes. At the risk of false signals and coincidental correlations, SPX industries that consistently are relatively more vulnerable, or less favourably inclined, to the Euro rising (and conversely, relatively more favourably disposed, or less vulnerable, to its falling) include: insurance, banks & diversified financials. On the other side of the coin, SPX industries that consistently are relatively more vulnerable, or less favourably inclined, to the Euro falling (and conversely, relatively more favourably disposed, or less vulnerable, to its rising) include: real-estate.
Given the flux in the SPX-Euro relationship I took a look at its changing behaviour & SPX industry correlation response over the most recent past in an attempt to discern any convincing industry themes agnostic to the traditional FX regime (SPX and Euro +ve/-ve in tandem) or to the US centric regime (SPX +ve/-ve while Euro –ve/+ve).
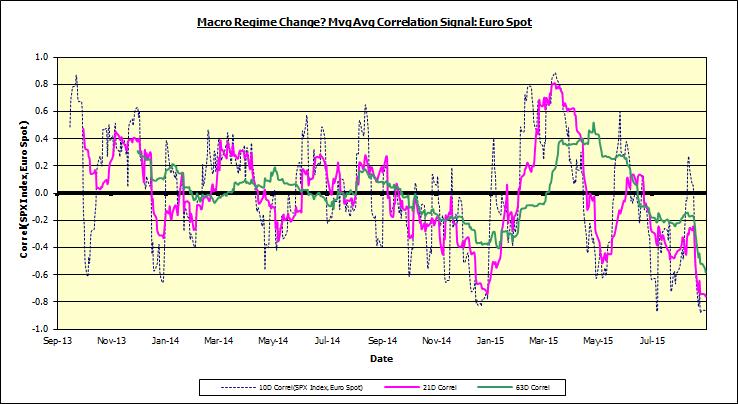
The time-series chart below frames the analysis by tracing the SPX-Euro moving average correlation over the last 2y. As the schizophrenic chart attests, there have been multiple forceful instances of traditional FX as well as US centric behaviour.
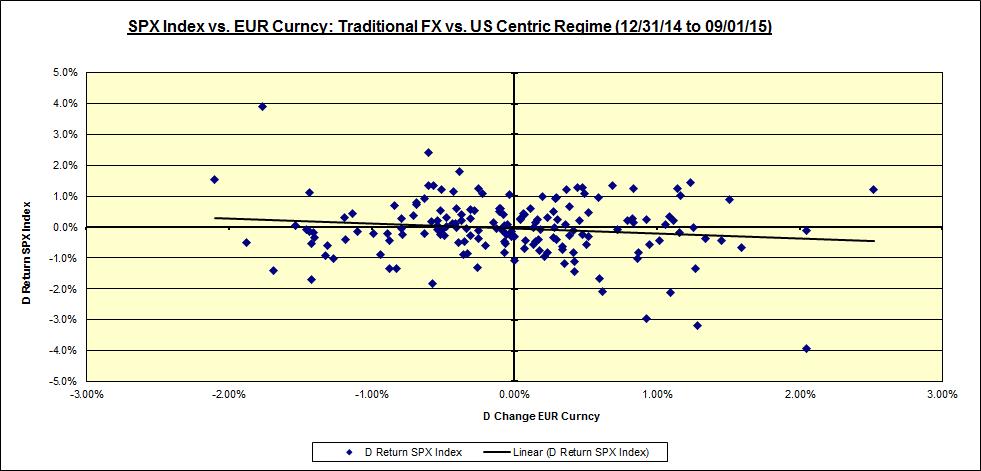
Telescoping YTD, the scatterplot below shows that the dynamic has on average been fairly random.
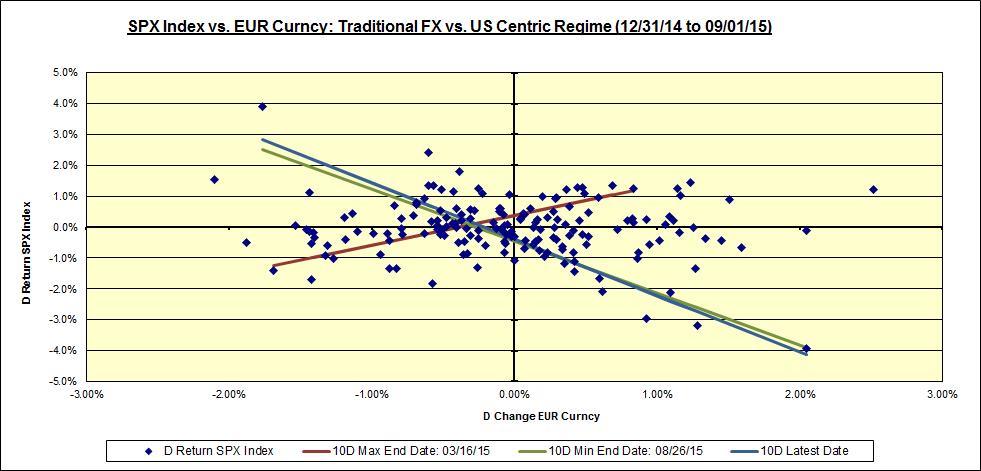
However, this aggregated data belies the more forceful regime behaviour that has frequently prevailed, in the ST, within this YTD horizon. The chart below superimposes the most forceful instances of ST regime behaviour via their piece-wise regression lines, statistical-significance notwithstanding. The brown line reflects the traditional FX regime prevalent during the 10d ending 03/16/15 (correlation +0.9) and the green line depicts the US centric regime prevalent during the 10d ending 08/26/15 (correlation -0.9). The blue line estimates the latest 10d behaviour.
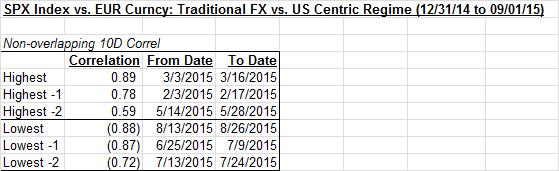
As illustrated in the table below, using 10d non-overlapping windows YTD, there have been multiple instances of forceful SPX-Euro behavior in either direction (though the US centric regime has been dominant most recently).
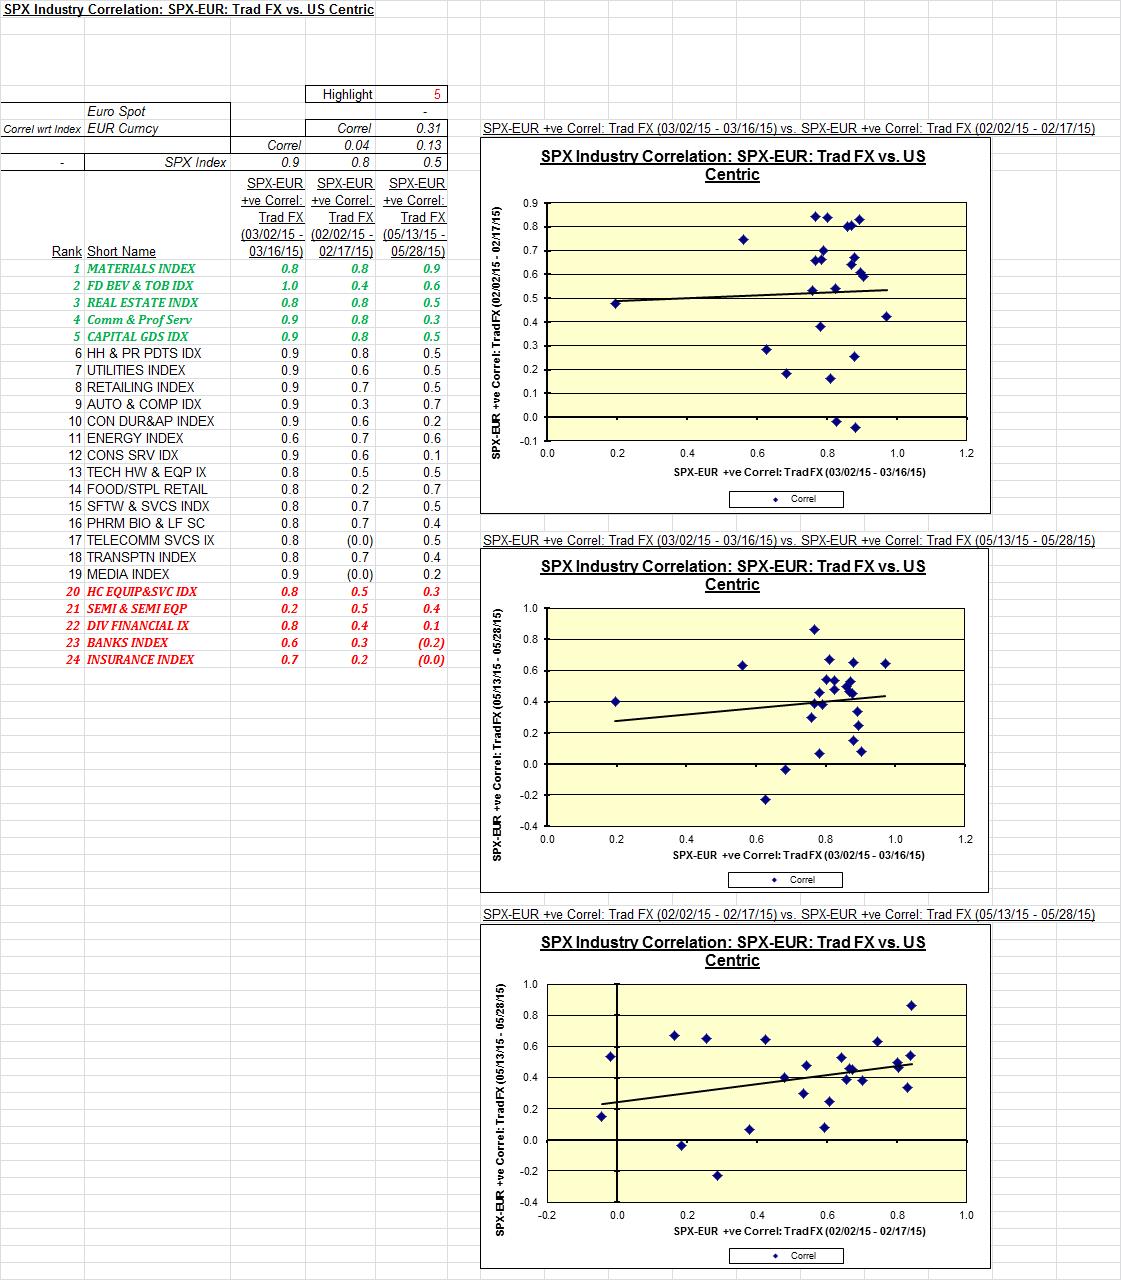
SPX industry response during recent traditional FX & US centric regime periods:
Next, I attempted to discern if there were any consistent industry themes, agnostic to regime behaviour, by focusing on the 3 most +ve and –ve episodic 10d correlation (traditional FX and US centric) sub-horizons and associated industry intersection at correlation extremes. These are aggregated using a composite ranking methodology and are reflected below and noted in the “punch line” above.
Traditional FX Regime:
US Centric Regime:
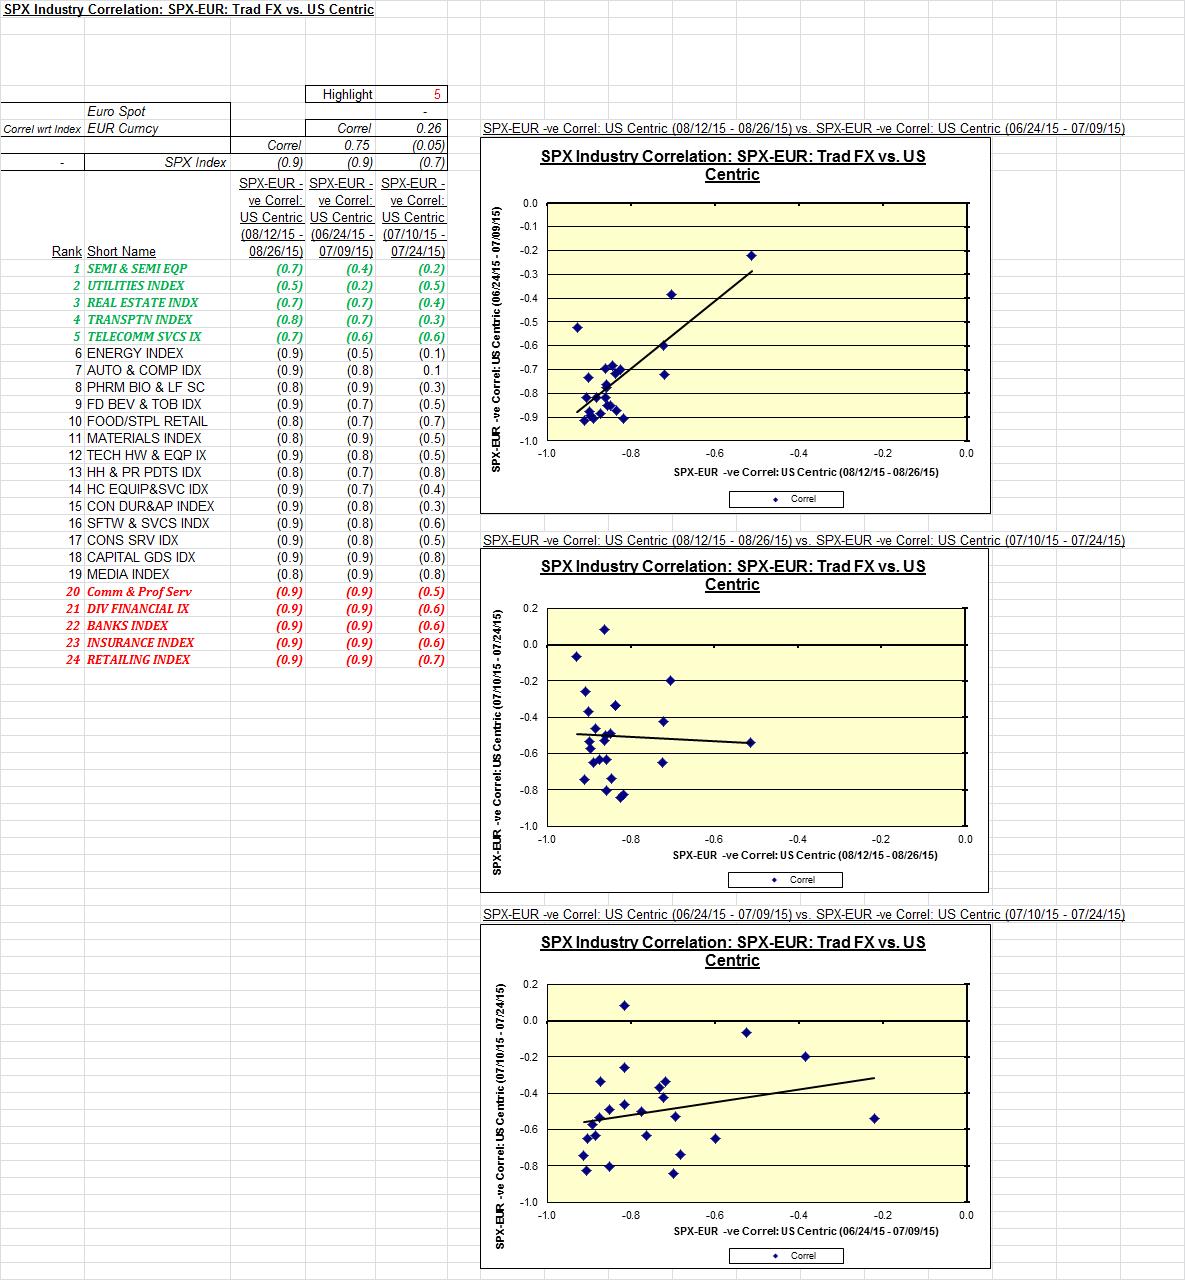
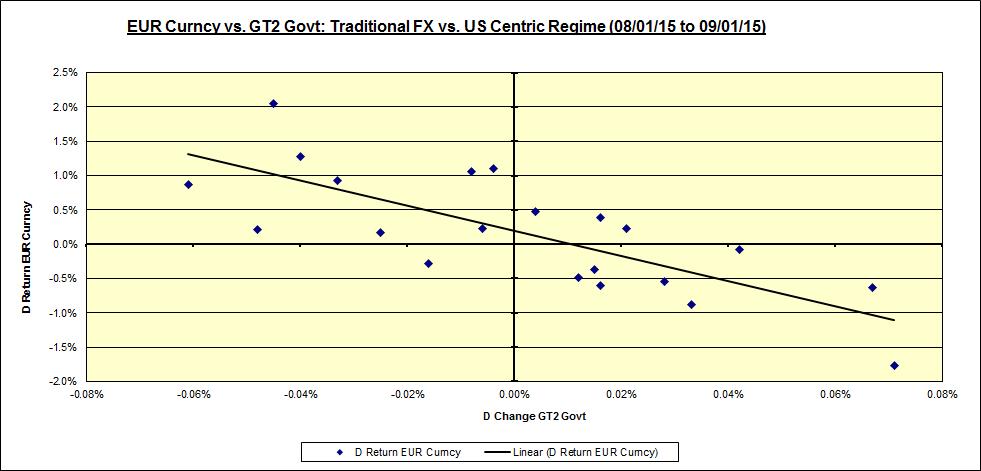
The common thread causing insurance, banks and diversified financials to be consistently relatively more vulnerable to a rising Euro (and conversely, relatively more favourably disposed to a falling Euro), in the most recent US centric regime, is probably the interest-rate differential regime the Euro has been trading in which is alluded to in the scatterplot below (last 1m using UST2y):
Note: calculations Risk Advisors, data Bloomberg
Proprietary and confidential to Risk Advisors