
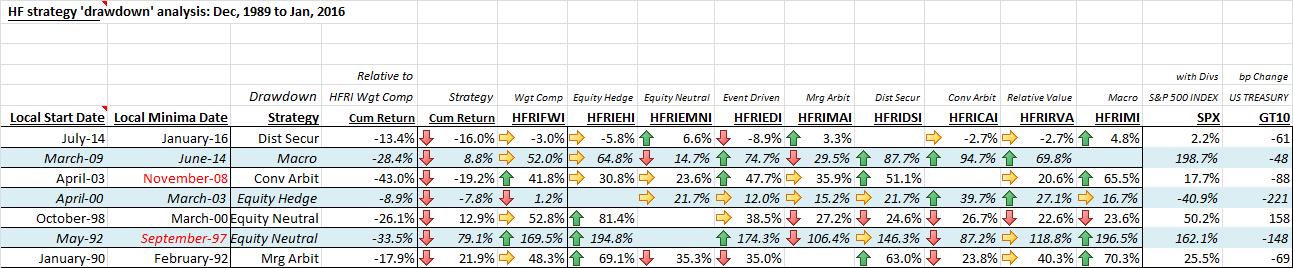
Punch line: using an algorithm to isolate HFR’s hedge fund strategy indices experiencing the worst local relative-return selloff, sequentially folding backwards from today, reveals that HFRI distressed index has returned -16% vs.-3% for the HFRI weighted composite index over the latest drawdown episode lasting ~18 months.
The following analysis chronicles the time-wise drawdown of HFR’s hedge fund strategy indices over the last 25 years using a dynamic, path-dependent, fold-back methodology (using a modified high-water mark to avoid “drawdown trap” and prod strategy rotation).
The algorithm starts at the latest date and surveys HFR’s hedge fund strategies to identify the “drawdown” strategy that has experienced (is experiencing) the worst local relative-return selloff minima (relative to the HFRI weighted composite index); it details the magnitude of the selloff, from its local start date to its local minima date, along with returns of all other HFRI strategies and commensurate SPX returns and change in UST10y yields. It then folds back to the “drawdown” strategies local start date and repeats the procedure based on the magnitude of the then prevalent local relative-return selloff strategy minima’s; and so it folds all the way back to 1990. The time-wise “drawdown” strategies are reflected in the chart below (reverse chronology):
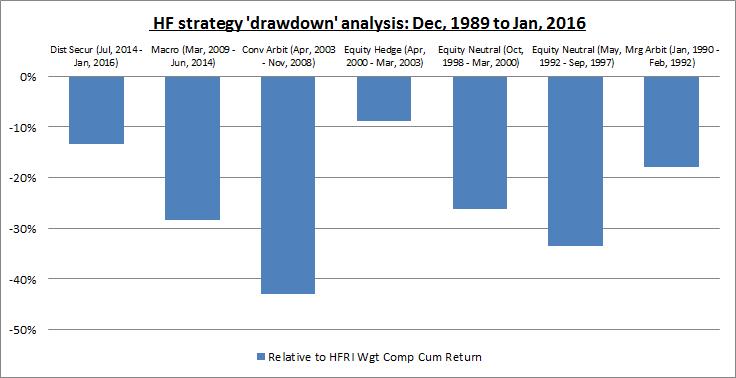
By way of an example, HFRI distressed index is the latest drawdown strategy, whose underperformance phase commenced in July, 2014 and is ongoing as of Jan, 2016. It suffered a relative excess return of -13.4% vs. the HFRI weighted composite index, by returning -16.0% vs. -3.0% for the HFRI weighted composite index. Reading across the row displays HFRI index returns for all other strategies along with commensurate SPX returns and change in UST10y yields. (Please review pdf link below for magnified detail.)
A few high-level comments gleaned from the analysis:
- equity market neutral underperformed other strategies and was tagged twice as the worst relative drawdown offender in the directional 90’s
- convertible arb recorded the worst relative drawdown, from spring 2003 until, and punctuated by, the GFC
- post GFC, from spring 2009 until summer 2014, when macro was the worst relative drawdown strategy, the SPX outclassed the best performing strategy, convertible arb, by over 100%
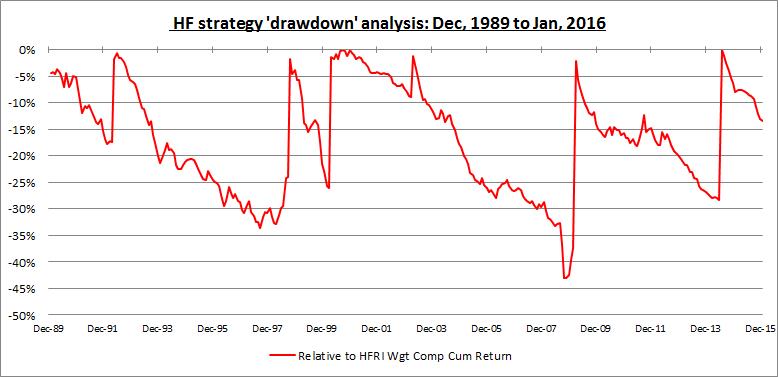
Finally, the time-series chart below traces the path of the worst contiguous drawdown episodes:
Note: calculations Risk Advisors, data Bloomberg
Proprietary and confidential to Risk Advisors