
Punch line: Market participants often tout the predictive powers of the VIX in being able to foretell prospective market (S&P 500) returns, particularly for market snapbacks given elevated levels of the VIX.
Contrary to popular belief, the VIX has virtually no predictive power in being able to accurately divine future returns. Further, what appears to be a positive relationship between the VIX and future 21d returns, particularly for elevated levels of the VIX, can in fact be largely explained by prior weakness of the market itself, whereby it sows the seeds for its own future price appreciation (weak trailing 21d returns result in the VIX being marked higher (sentiment, put demand, moving up the skew etc.) which in turn lead to mean reversionary positive prospective 21d returns).
Far from being the harbinger of future asset prices the VIX is largely reactive in nature. Indeed, trailing returns helped explain the current level, and trend, in the VIX. Specifically, the correlation between trailing 21-day market returns and the current level of the VIX was -0.5.
The following is a graphical analysis of the relationship between the VIX and market (S&P 500) returns, over the last 5+ years (01/01/10 to date), a period that included ascending, descending and sideways price action.
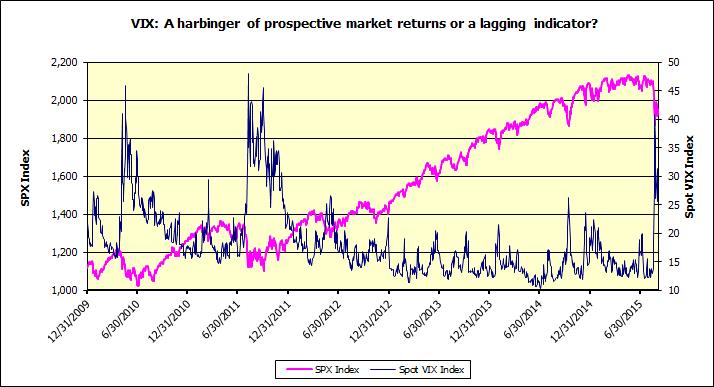
In order to frame the study, the following graph charts the S&P 500 and the VIX index over this time period.
The following chart is a scatter plot of the VIX index, arranged in ascending order, vs. the following 1-day market return. In other words, it plots the VIX level on Day X vs. the market return between Day X and Day X+1.
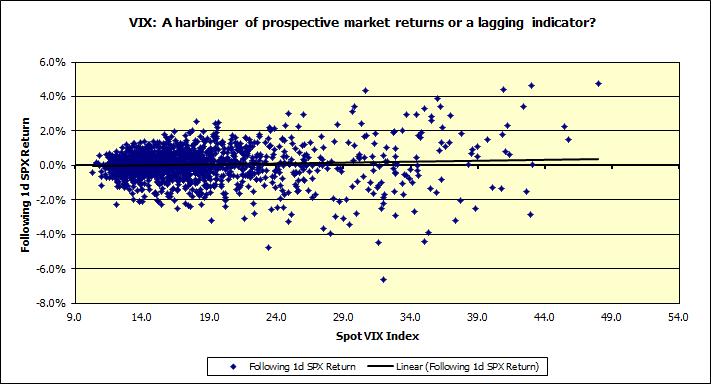
If the VIX had short-term predictive abilities one might expect the data to display a positive causal relationship. A visual inspection suggests no significant predictive powers.
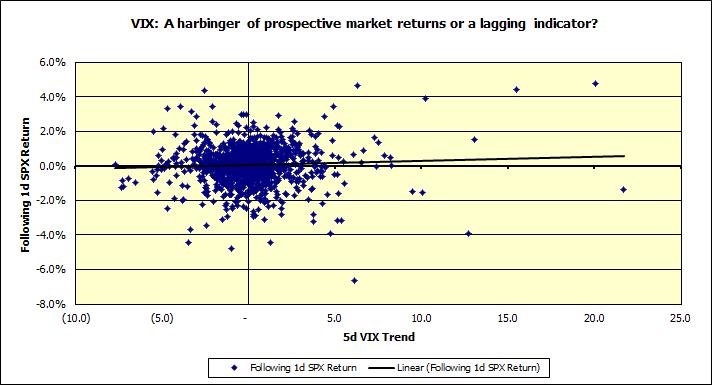
The relationship between VIX 5d trend (VIX on Day X, less average of VIX on Day X-4 through Day X-1) and following 1d market return was similarly insipid.
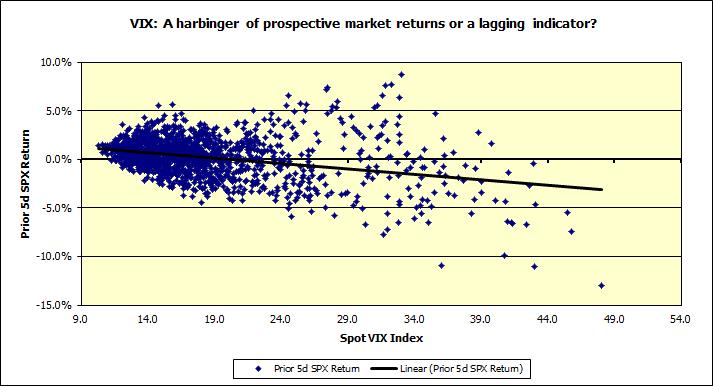
The relationship between the VIX, current level and 5d trend, and following 5d returns was similar; though one notices a greater preponderance of positive following 5d returns for higher spot levels of the VIX and 5d VIX trend (I exclude these charts for sake of brevity). This phenomenon is reflected in the next chart which explores the relationship between the VIX and following 21d market return.
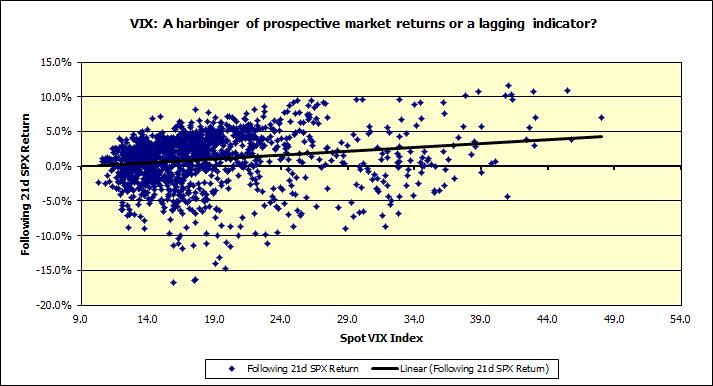
At higher levels of the VIX (>40) one notices that virtually all following 21d returns are positive which causes the trend line to slope upwards despite otherwise fairly random dispersion (correlation 0.2). However, as I will show later, this is due to weak trailing return behavior, which drives the VIX level higher, and also leads to mean reversionary positive future return outcomes.
Since the VIX, current level and trend, doesn’t seem to do a particularly good job in forecasting prospective market returns I explored the opposite postulate: Do historical market returns help explain the VIX?
A plot of the VIX level vs. the prior 5d market returns (VIX on Day X vs. market return between Day X-5 and Day X) exhibits a mildly negative relationship. The correlation between the two variables is -0.3. Using trailing 21d market returns betters the fit to a correlation of -0.5. These 2 charts are displayed in succession below. At last something to sink ones teeth into.
And,
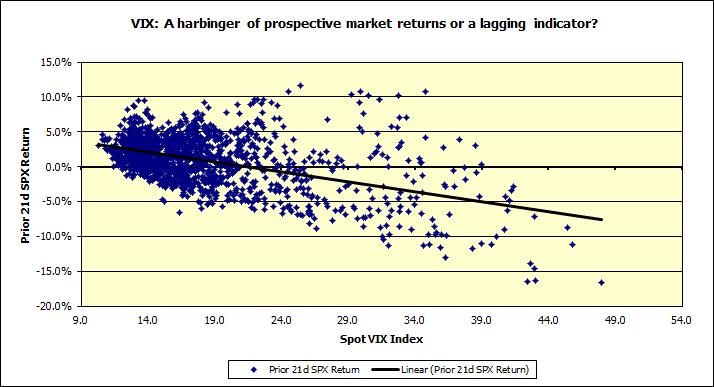
Observe how elevated VIX levels (>40) are associated with negative trailing 21d returns.
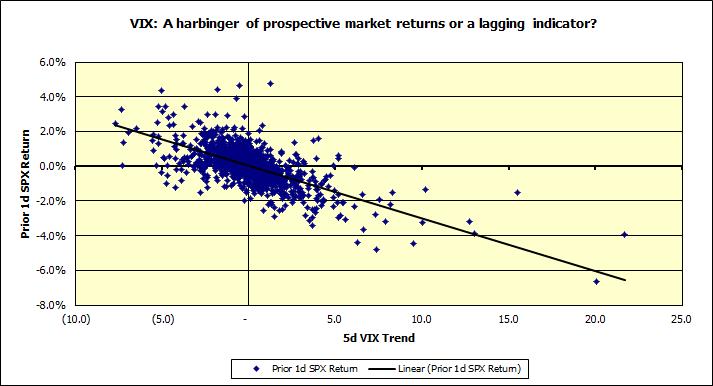
This lagging behavior was further solidified, despite some bolstering by the familiar inverse relationship between contemporaneous VIX changes and market returns, by focusing on the relationship between trailing 1d returns and 5d VIX trend (correlation 0.7). Trailing 5d returns and VIX 5d trend produced similar, slightly weaker, results. Unfortunately it suggests that far from being a prospective indicator, the VIX is a lagging indicator.
Turning back to the observed positive following 21d returns, at higher VIX levels (>40), we are now in a position to try and help explain that phenomenon. Since trailing returns help explain the current VIX level, could they in turn help determine prospective returns? The chart below shows that over the entire data set prior 21d returns have very weakly lead to mean reversionary following 21d returns (correlation -0.2).
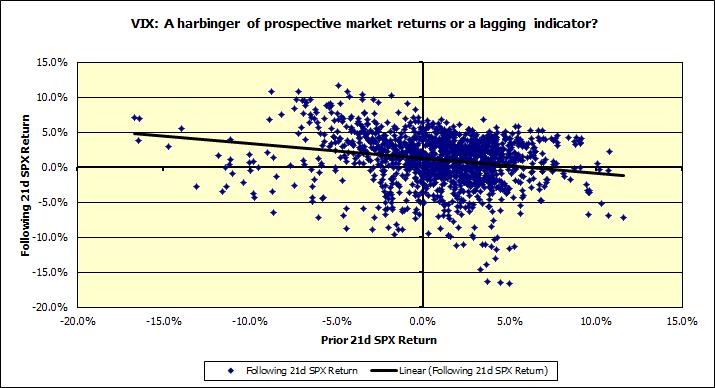
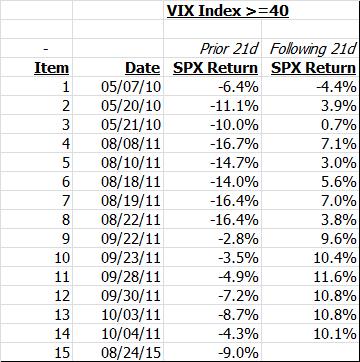
And more specifically, if we isolate the 15 episodes of elevated VIX levels (>=40), albeit often contiguous, virtually all of them were associated with negative trailing 21d returns and were almost always followed by positive subsequent 21d returns; current 08/24/15 signal TBA.
Finally, for the sake of completeness, the correlation statistics implied in this study are presented below:
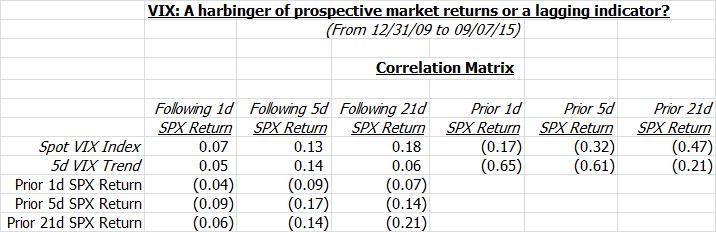
Conclusion:
The oft-touted assertion that the VIX helps forecast future market returns is long on rhetoric and short on fact when examined using data over the last several years. Indeed, far from displaying predictive abilities, the VIX exhibits reactive tendencies with respect to historical market returns.
Encouragingly, in similar studies I have done in the past on the VIX itself and on sentiment indicators like Market Vane’s bullish consensus figures, or risk-reversals (implied, put – call, OTM vol) in the $/Yen market, have all revealed similar behavior. Indeed if they truly had predictive ability this would be arbitraged away in these highly efficient, liquid markets.
Additionally, the logical extension of this, random behavior aside, is that in periods where it seems that sentiment drives subsequent performance, it is instructive to note that sentiment in turn is driven by prior performance, and hence subsequent performance may be dependent on prior performance. Thus in a momentum market prior performance drives sentiment which drives continued trend performance, and in a range-bound market, prior performance, drives sentiment, which sows the seeds for contra trend behavior; thus we might see mean reversionary return behavior, where prior out/under performance would be followed by the reverse.
It is my conjecture that positioning barometers such as ISI sector weightings are perhaps somewhat similar insofar that sector over/under weightings are Pavlovian, at least at an aggregate level, and hence current sector positioning may be a function of prior sector performance, which in a momentum market drive continued trend performance and in a range-bound/rotation market sows the seeds for its own cyclical destruction.
Note: calculations Risk Advisors, data Bloomberg
Proprietary and confidential to Risk Advisors