
Punch line: the first year following the first hike during the 1994, 1999 and 2004 rate hike cycles saw differing equity-bond relationships: 1994 was classical long-duration while 1999 and 2004 were fairly regime agnostic. S&P500 industry group performance was quite disparate too. Joint underperformers, over these three periods, included auto components, air freight & logistics, automobiles, paper & forest products and building products; similarly wireless telecom services, biotech, computers & peripherals, O&G consumable fuels and HC providers & services topped the joint outperformer industry group pack.
Since 1990 there have been 4 tightening cycles (3 really as 3/25/97 was an isolated, fine-tuning event). Each cycle was fairly unique and one can find similarities and differences between them and the potentially forthcoming tightening episode. Very broadly the 3 prior tightening cycles were:
- 02/94 – 02/95: A full cycle post the protracted period of easy money designed to bail out thrifts and banks via the Fed engineered steep yield curve, which in turn followed the recession of 1990-91.
- 06/99 – 05/00: A targeted tethering to wring out the prior risk-premium crisis (Asia, Russia and LTCM) related easing, accommodation for Y2K gremlins and the burgeoning irrational exuberance in asset markets.
- 06/04 – 6/06: Another full-cycle tightening, and an experiment in Greenspan 25bp incrementalism, which followed the earlier easing cycle designed to cushion the fallout from the technology bubble and various geo-political crises, enabling corporate America to rebuild its balance sheet following the shallow 2001 recession.
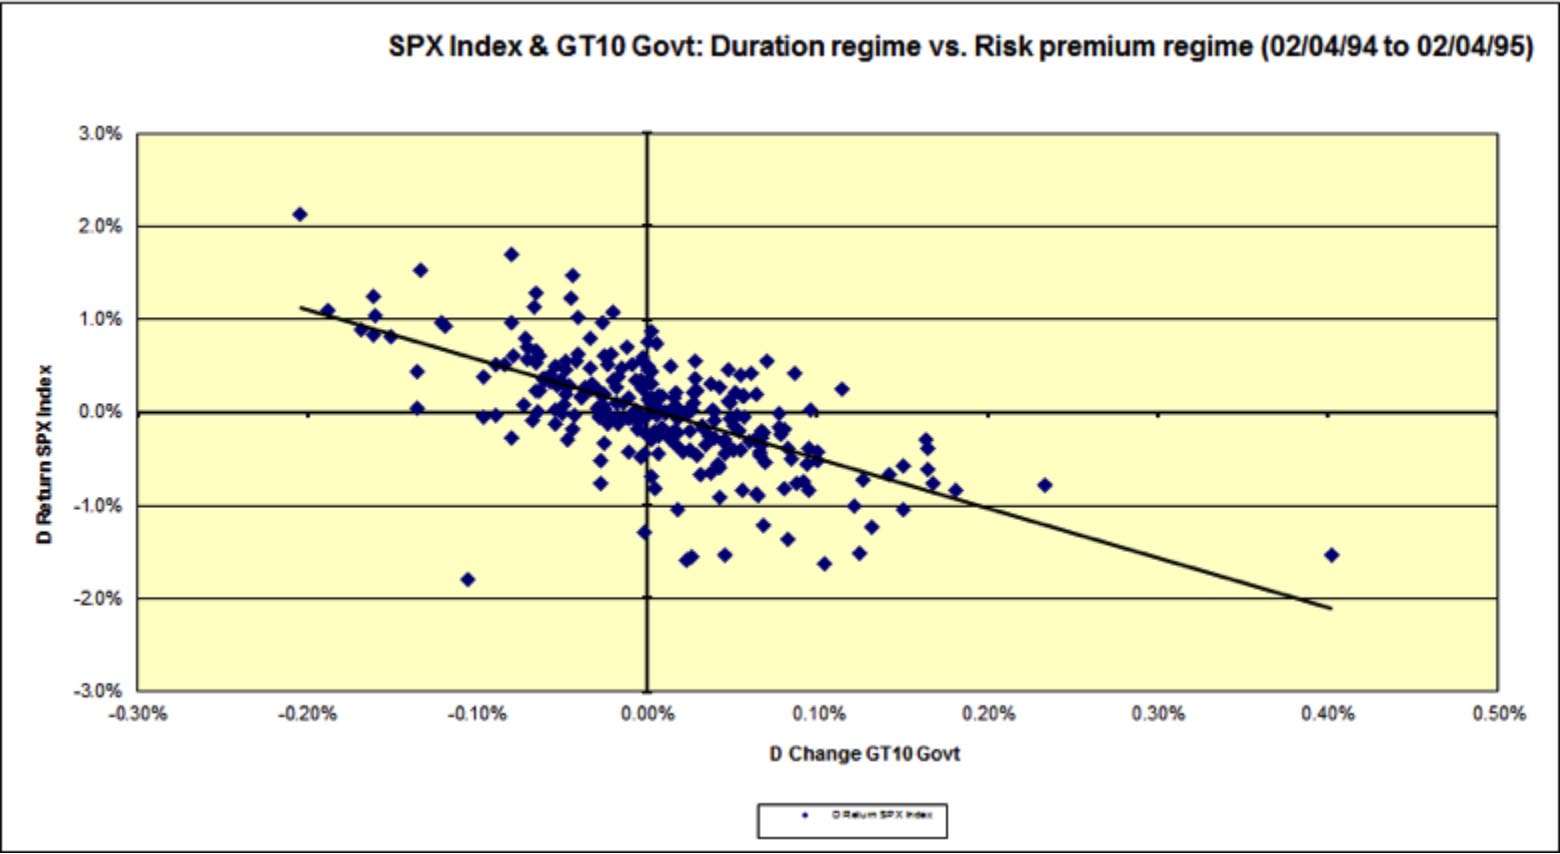
The year following the first hike during the 1994, 1999 and 2004 rate hike cycles saw markedly different equity-bond relationships. 1994 displayed the classical long-duration responsiveness (higher/lower rates, lower/higher SPX) whereas 1999 and 2004 were fairly regime agnostic displaying both long-duration and risk on/off behavior (higher/lower rates, higher/lower SPX). This is succinctly shown via the scatterplots below.
The year following the first 1994 hike (daily SPX returns vs. daily UST10y yield change) was strongly duration-regime biased:
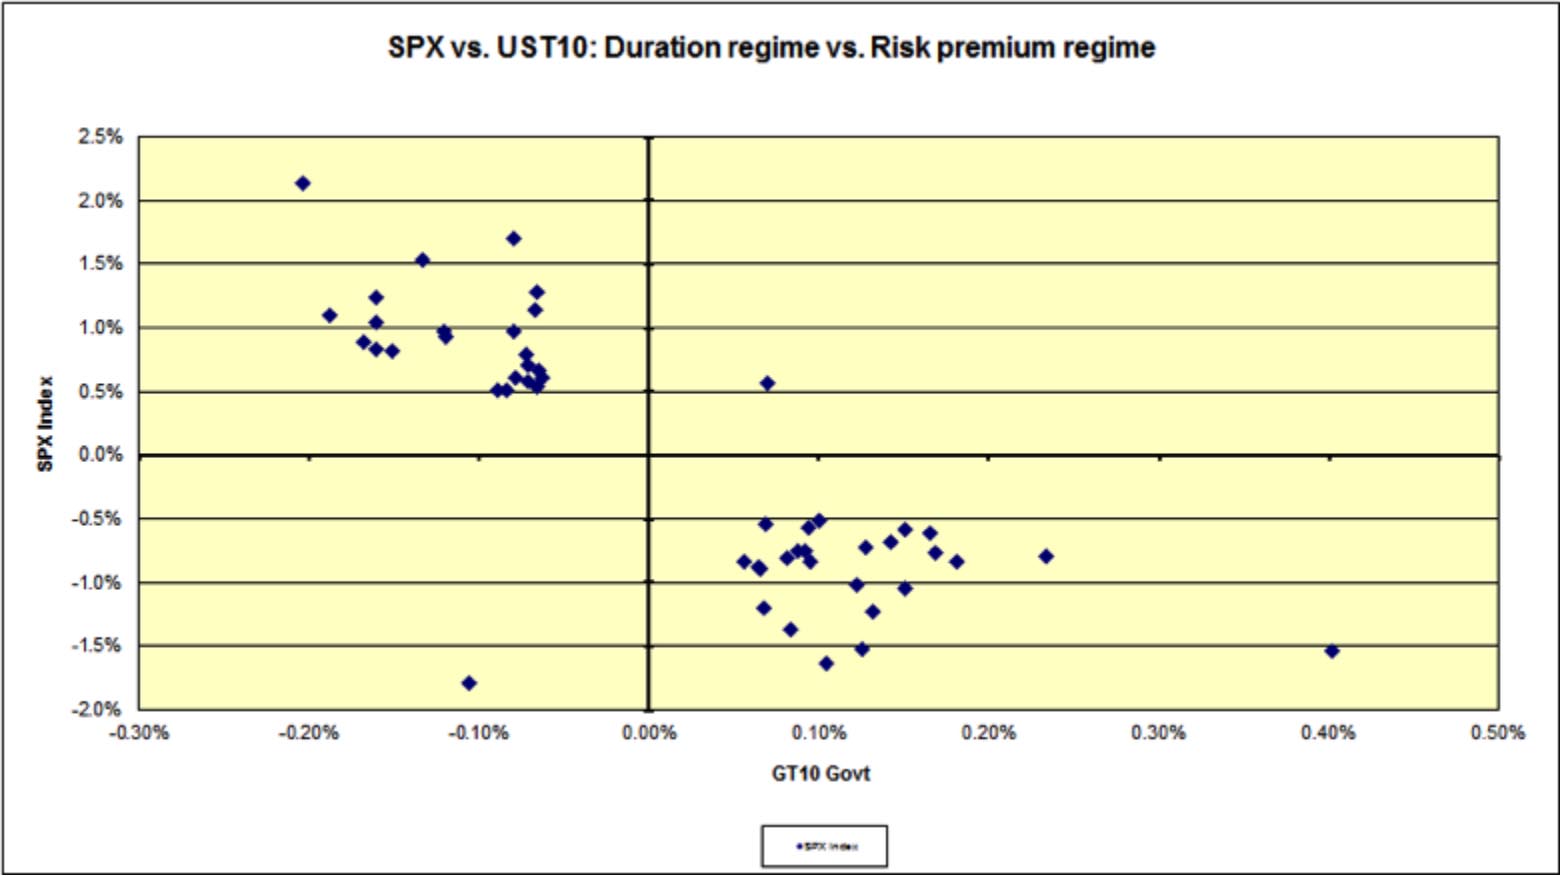
The same 1994 data, as above, but telescoping to “significant” days (SPX >= +/- 50bps, UST10 yield >= +/- 5bps) which vividly reveals the preponderance of “significant” long-duration responsiveness:
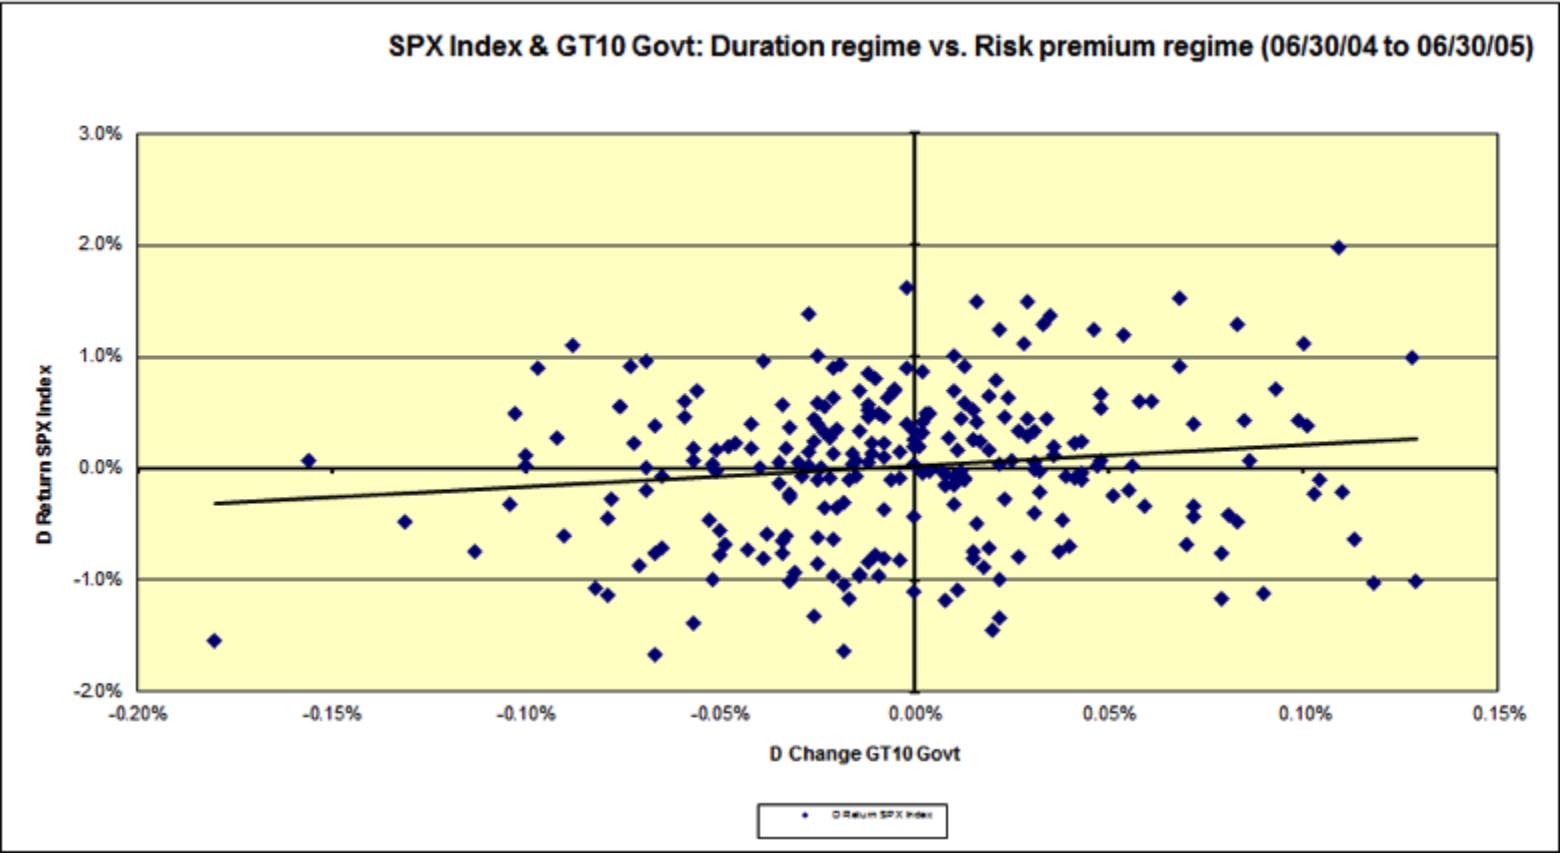
The year following the first 2004 hike (daily SPX returns vs. daily UST10y yield change) was largely regime agnostic:
The same 2004 data, as above, but telescoping to “significant” days (SPX >= +/- 50bps, UST10 yield >= +/- 5bps) shows all four quadrants fairly well populated:
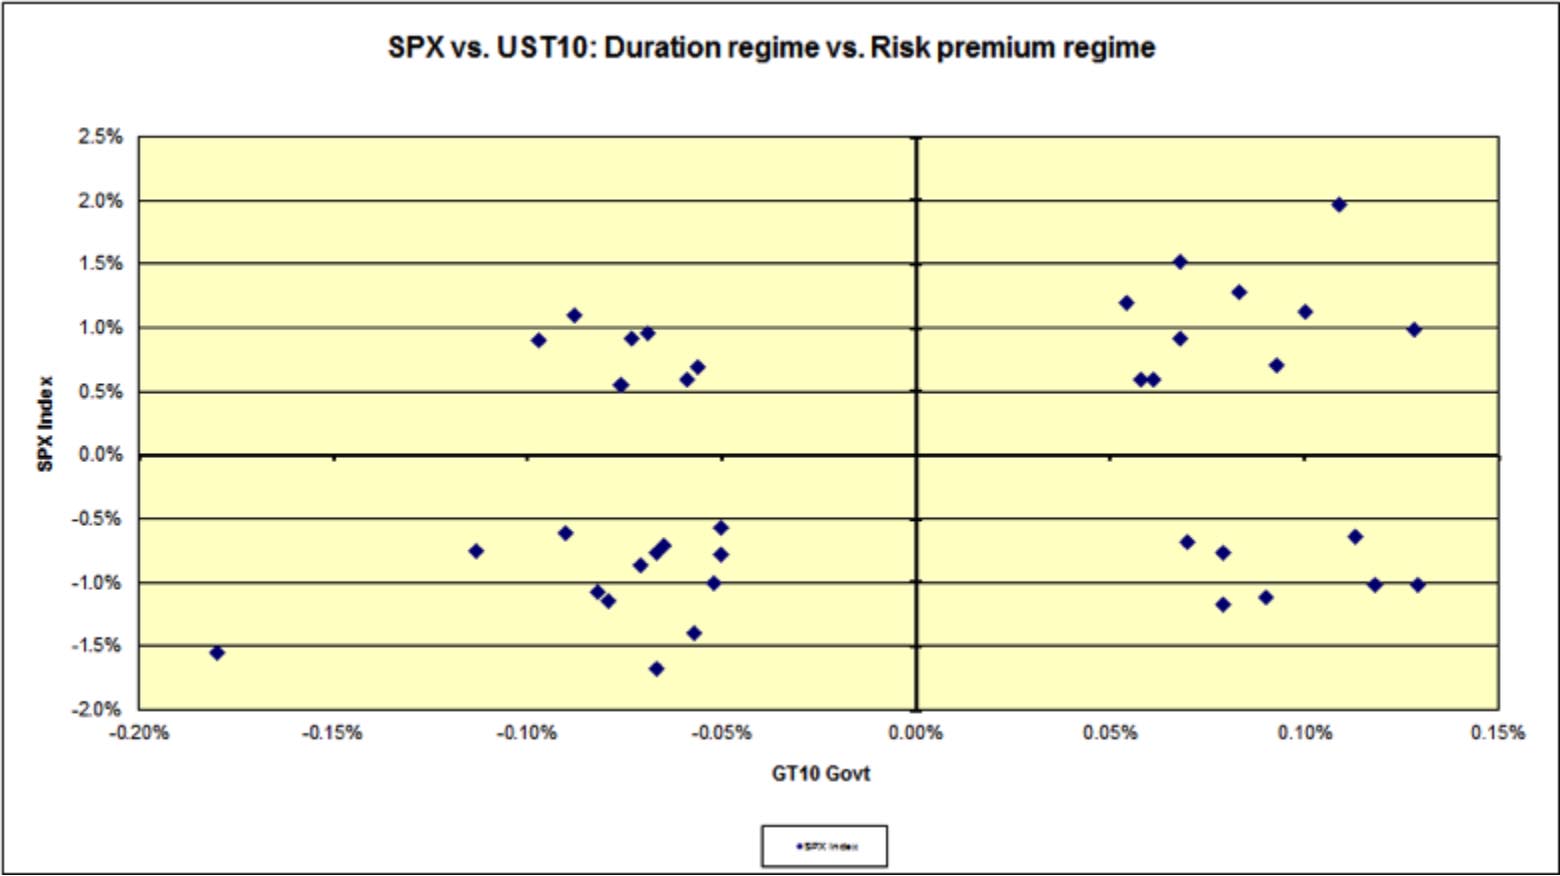
1999 was much like 2004 in terms of regime noise and charts are not shown for sake of brevity.
S&P500 industry performance: using a composite ranking methodology to tease out joint underperformers, over all three periods (1994, 1999 and 2004), reveals auto components, air freight & logistics, automobiles, paper & forest products and building products lagged the pack; similarly wireless telecom services, biotech, computers & peripherals, O&G consumable fuels and HC providers & services topped the joint outperformer industry group pack.
Further, SPX industry performance, in the first year following the first hike, during the 1994 episode was moderately correlated with the 1999 period (and quite random with 2004, as were the 1999 vs. 2004 correlations). These are shown in the table and charts below:
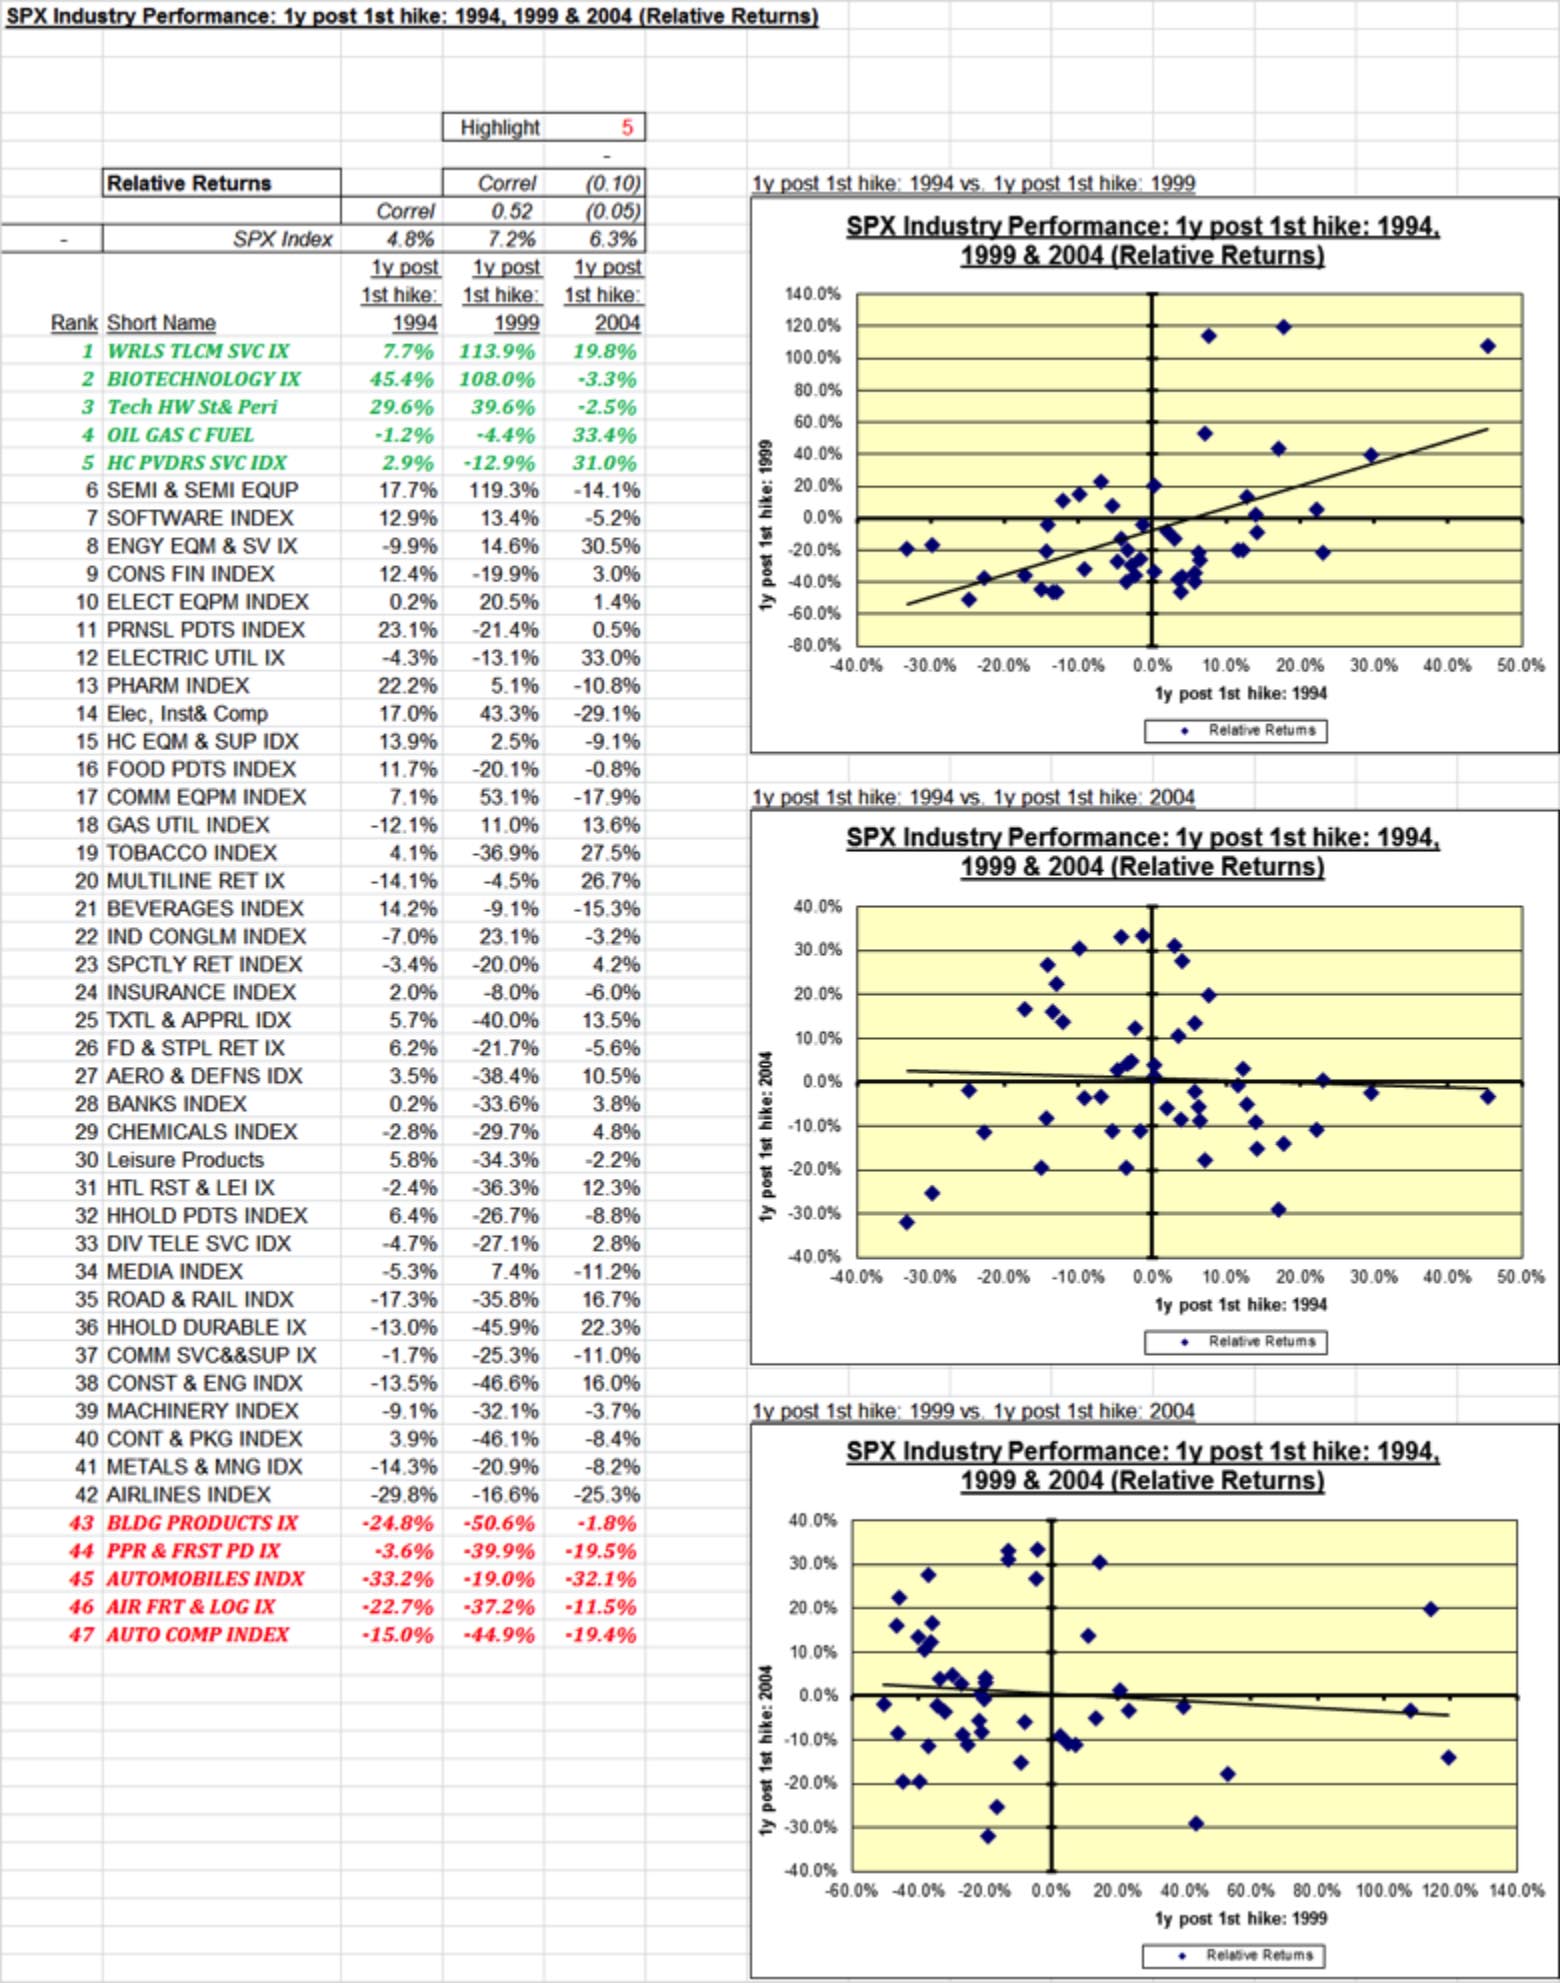
Note: calculations Risk Advisors, data Bloomberg
Proprietary and confidential to Risk Advisors