
Punch line: the return-to-trough ratio (“RtT”) attempts to measure return generated relative to maximum pain incurred. Computationally, RtT = return, divided by, worst drawdown.
The road to hell is paved with good intentions and risk-reward metrics. At the risk of increasing the detritus consider yet another risk-return metric: the return-to-trough ratio.
The benefits of convenient single-number metrics, like risk-adjusted return or Sharpe ratio, or their downside cousins, that encapsulate both risk and return must be weighed against their associated costs. To wit: actual return distributions are frequently discontinuous, jagged, misshapen and fat-tailed (the 100-year flood occurs every few years in financial time series); strategies with inherent optionality, long or short, aren’t well represented by standard risk-reward metrics; ratios, including the return-to-trough ratio, can be magnified due to a de minimis denominator.
Further, the real-world practical manifestation of risk is the potential for losing money. Ex-post, this is perhaps best represented by drawdown which, by focusing on the actual loss experienced during a phase of onerous underperformance, is agnostic to the subtleties of the distributional assumptions underlying standard risk metrics.
Putting this all together, the return-to-trough ratio (“RtT”) attempts to measure return generated relative to maximum pain incurred. It typically works best over longer horizons.
Computationally, RtT = return, divided by, worst drawdown. In its raw form it uses cumulative returns and worst drawdown over the horizon detailed. However, the raw cumulative RtT can be somewhat amplified as horizon length increases as returns cumulate with time while volatility, which begets drawdown, tends to expand with the square root of time. Hence, annual-equivalent RtT, my preferred poison, uses annualized returns in the numerator and worst drawdown, deflated by the square root of the investment horizon, in the denominator. By creating a level-time playing field annual-equivalent RtT can help facilitate comparison; both cross sectional between assets as well inter temporal for the same asset.
Shown below is an illustration of the RtT procedure for the S&P500 (“SPX”), followed by the RtT ranking of the SPX sectors; both using trailing 5-year data.
The following table and chart illustrate the drawdown episodes for the SPX over the last 5 years:
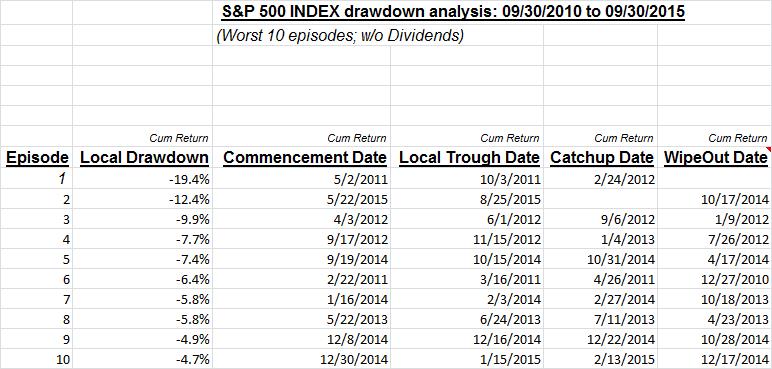
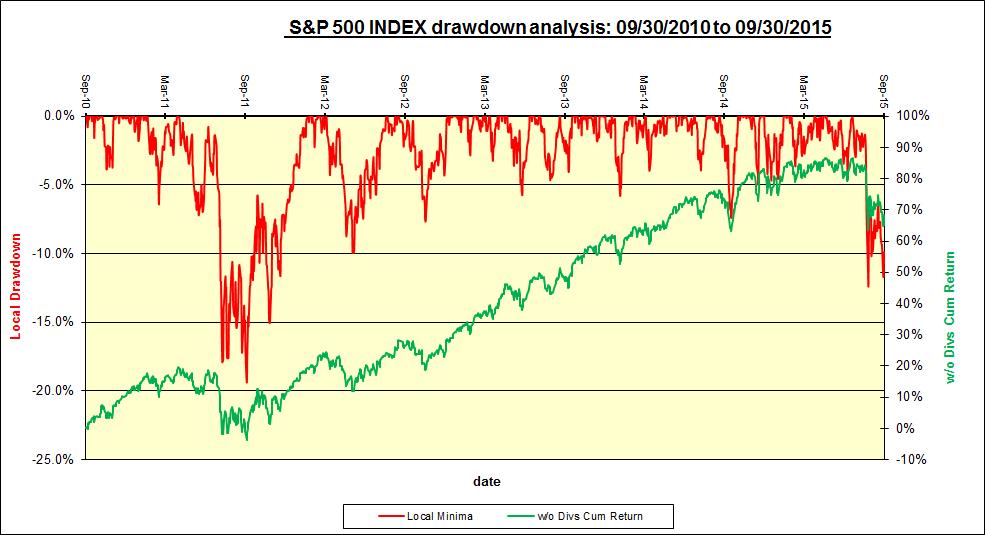
The trailing 5-year cumulative SPX return (with dividends) was 87.0%, or 13.3% on an annualized basis, and the worst drawdown was 19.4% (absolute value; price-based returns).
Cumulative RtT = 87.0%/19.4% = 4.5
Annualized RtT = 13.3%/[19.4%*(1/5)^0.5] = 1.5
Finally, the trailing 5-year RtT ratio of the SPX sectors, ranked by annualized RtT, are shown below:
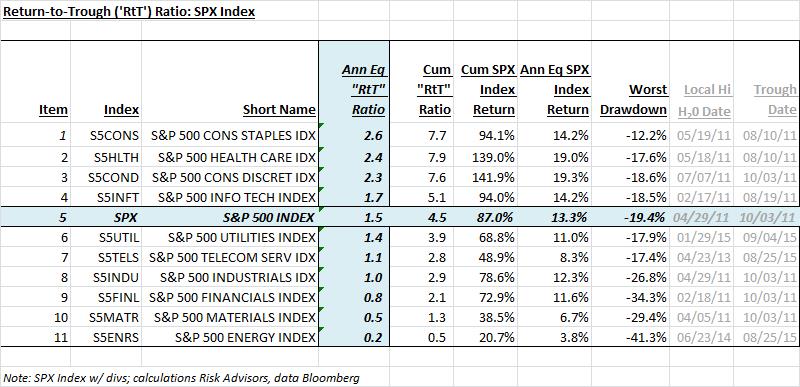
Note: calculations Risk Advisors, data Bloomberg
Proprietary and confidential to Risk Advisors