
Punch line: using an algorithm to isolate sectors experiencing the worst local relative-return selloff, sequentially folding backwards from today, reveals that the energy sector has returned -25% vs. 46% for the SPX over the latest drawdown episode lasting 4+ years; other sector returns over this period have ranged from 3% for materials to 112% for healthcare (price-based returns).
The following analysis chronicles the time-wise drawdown of S&P500 sectors over the last 25 years using a dynamic, path-dependent, fold-back methodology (using a modified high-water mark to avoid drawdown trap and excluding sparsely-trafficked telecom services and utilities).
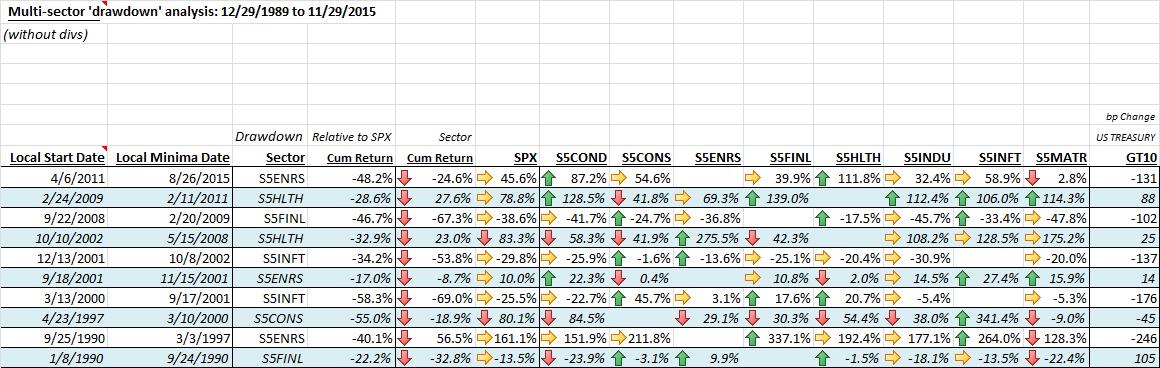
The algorithm starts at the latest date and surveys all sectors to identify the “drawdown” sector that has experienced (is experiencing) the worst local relative-return selloff minima (relative to the SPX); it details the magnitude of the selloff, from its local start date to its local minima date, along with returns of all other SPX sectors and change in UST10y yields. It then folds back to the “drawdown” sectors local start date and repeats the procedure based on the magnitude of the then prevalent local relative-return selloff sector minima’s; and so it folds all the way back to 1990. The time-wise “drawdown” sectors are reflected in the chart below (reverse chronology):
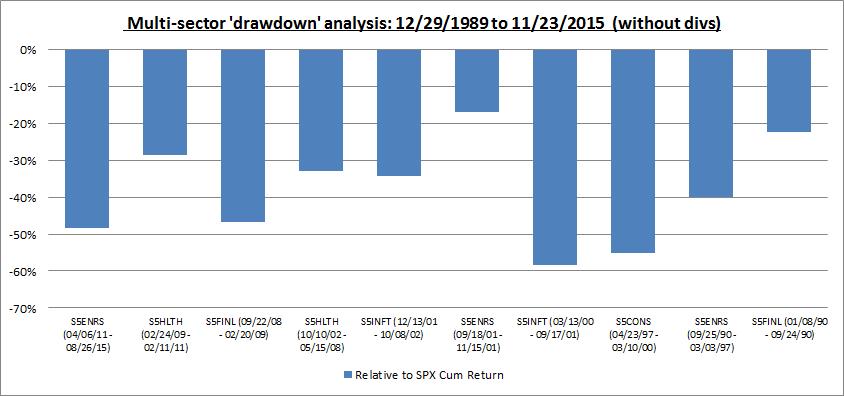
By way of an example, energy (S5ENRS) is the latest drawdown sector whose underperformance phase commenced on 04/06/2011 and troughed on 08/26/2015. It suffered a relative excess return of -48.2% vs. the SPX, by returning -24.6% vs. 45.6% for the SPX (price-based returns). Reading across the row displays sector returns for all other sectors and a 131bp fall in UST10y yields. (Please review pdf link below for magnified detail.)
sector drawdown chronology PDF
A few high-level comments gleaned from the analysis:
- a vivid reminder of info techs spectacular rise into Y2K was that it rose 341% during the 1997-00 “old” economy and consumer staples drawdown episode where the next best sector, consumer discretionary (which houses e-commerce retailers), rose 85%
- financials, which was a max drawdown sector in the 1990’s, displayed classical long-duration behavior then with higher UST10y yields vs. its GFC drawdown in late 2008/early 2009 and current pro-rate (risk-premium/growth-based) trading regime
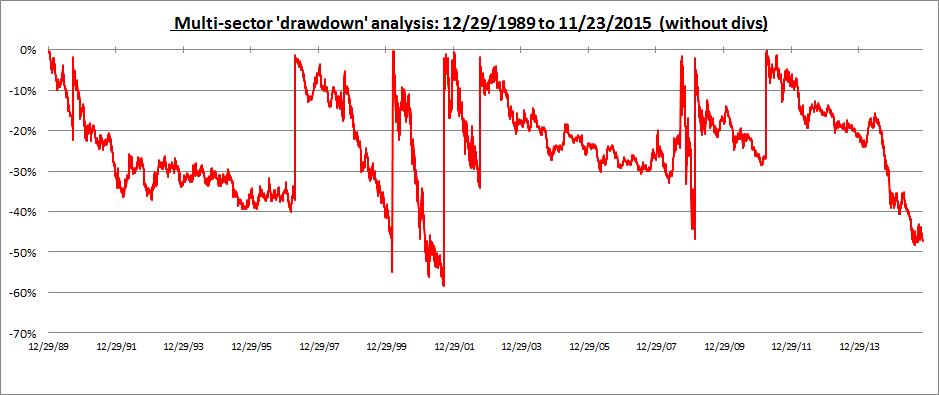
- several drawdown episodes were protracted affairs (energy 1990-97 and healthcare 2002-2008) and others were sharp abysses (info tech 2000-01 and financials 2008-09) as illustrated in the drawdown time-series chart below
Note: calculations Risk Advisors, data Bloomberg
Proprietary and confidential to Risk Advisors