
Punch line: I update the below ST macro risk gauge analysis on an ad hoc basis, when items are approaching/flirting with extreme levels: past 2-sigma fear levels in this instance; though upwardly magnified due to the low-volatility environment, latest moves notwithstanding. It is important to note that extreme values can persist for extended periods of time and, since this is a ST gauge, items can correct to normal levels simply by having the average adjust more rapidly.
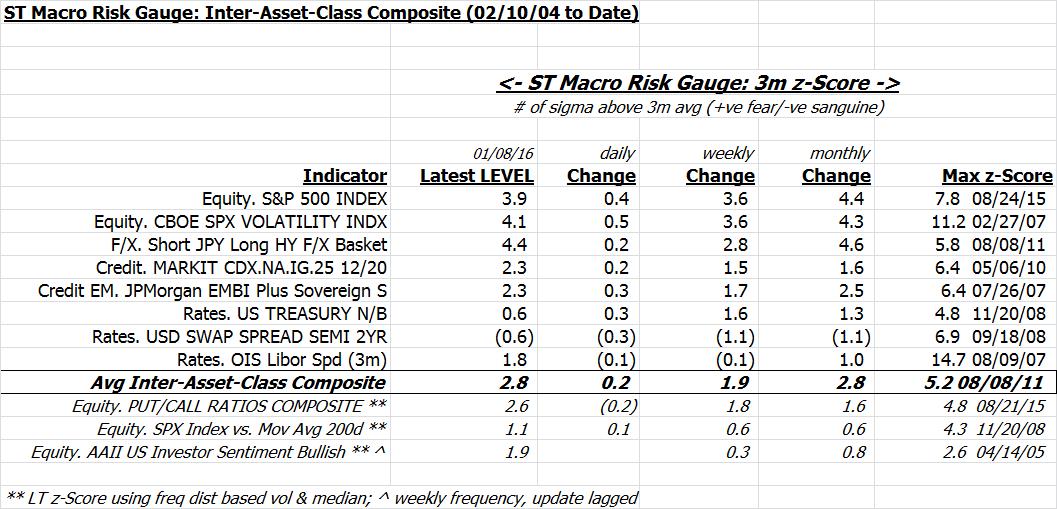
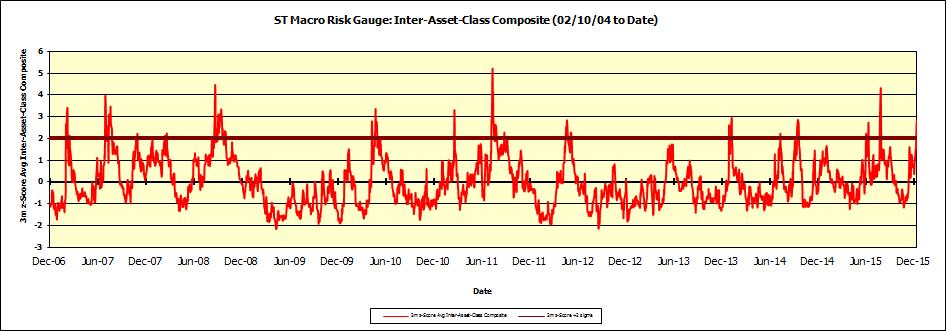
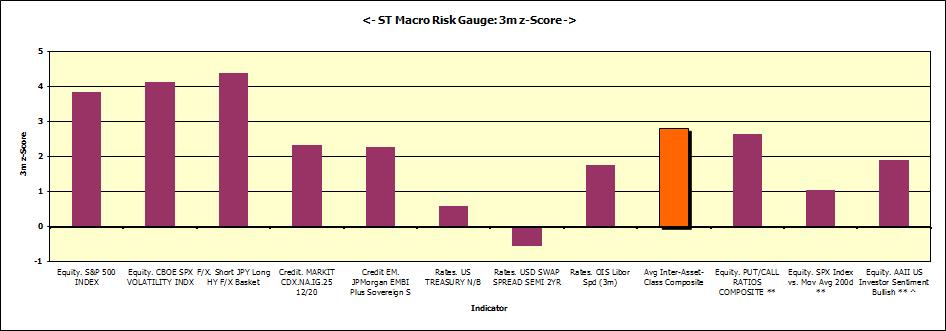
The following is a ST macro risk gauge that looks at the current state of major macro variables vs. their 3m mov avg, quoted in std devs (current state and d, w and m changes; +ve values connote relatively more fear, -ve more greed). Also stated are the max risk values recorded over the analysis horizon (2/10/04 to date) as comparative boundary conditions. The charts display a time series of the overall z-score and a cross section of the current state of the individual and overall risk values. I’ve used macro variables that tend to fairly unambiguously telegraph fear, subject to data availability and considering correlation amongst like gauges (for e.g,. 3m OIS and 3m TED are very well correlated).
Note: calculations Risk Advisors, data Bloomberg
Proprietary and confidential to Risk Advisors