
Punch line: given the latest systemic fragility, with banks being the latest flash point, I looked at the most onerous episodes of a cross asset-class contagion barometer, which spilt over into the US as manifest by the SPX selling off and the VIX rising concurrently, and the resultant SPX industry responsiveness. Per intuition, the most –vely exposed SPX industries, and thus most susceptible to a snap back, included: diversified financial services; autos; banks; and energy & materials (despite latest respite). On the other side of the coin: utilities; food, beverage & tobacco; food & staples retailing, telecomm services; and household & personal products relatively held up the best.
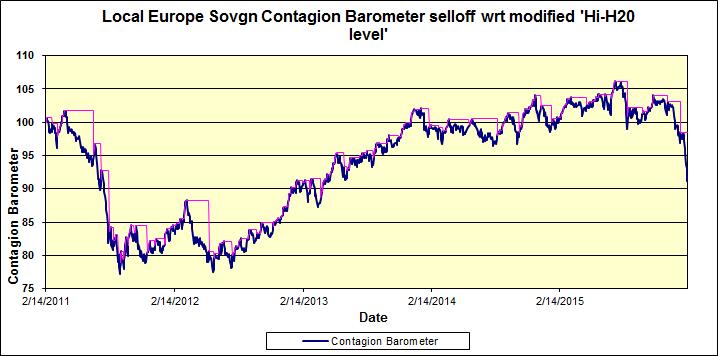
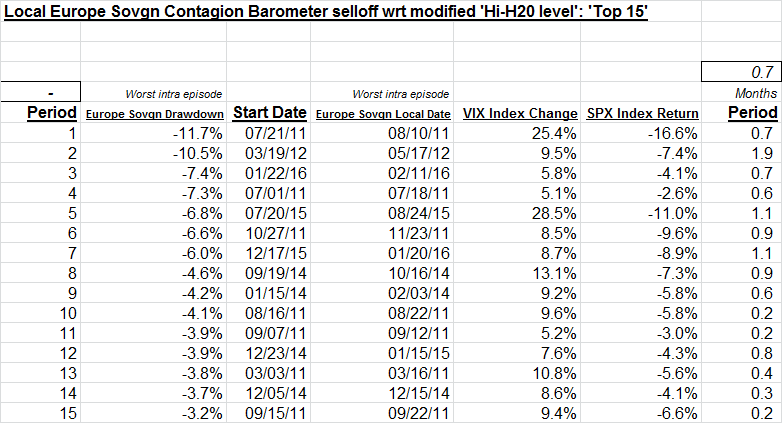
Given the latest systemic fragility in global risky assets and with banks being the latest flash point, I resurrected a cross asset-class Europe-driven contagion barometer (trailing 5y; subject to a modified high-water mark) that also triggered contagion across the Atlantic. The systemic contagion barometer includes: equities (banks: SX7E), volatility (V2X), rates (5y Bund), credit (Europe financials CDS), currency (JPY) and commodity (gold). To reflect contagion transmission into the US, I only selected episodes where the SPX returned <= -2.5% and VIX absolute level rose >= 5% and selected the 15 worst episodes which are shown below in graphical and tabular form.
Shown in the pdf link below are the S&P 500 industry statistics, for each of the 15 identified episodes, along with the average, median, % of time +ve and % of time –ve metrics. They are sorted using a composite ranking index. As the scenarios are quite disparate, it may be more meaningful to focus on environmentally pertinent episodes.
Systemic contagion barometer PDF
Note: calculations Risk Advisors, data Bloomberg
Proprietary and confidential to Risk Advisors