
Punch line: the following analysis illustrates the expected risk-return profile that results from various net/gross exposure combinations, in the context of market return and alpha expectation.
I’ve attempted to unite net and gross exposure, market return and volatility and alpha-generation propensity to help triangulate towards an expected risk-return surface, using returns net of all fees. I threw all the component inputs into a simulation blender, partitioned the portfolio return stream into a market component (scaled by net) and an alpha component (scaled by gross) and lay out the results below, following which I list the assumptions used (and there are many) and methodology followed. I should state at the outset that this is in the spirit of being very broadly illustrative and certainly makes no pretentions of being surgically precise.
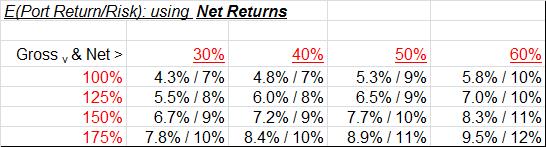
The matrix below shows portfolio net return/risk expectations for various gross and net exposure combinations. As an e.g., the intersection of 150% gross/ 50% net combination would yield an expected portfolio net return of 7.7% with a 10% volatility of net returns.
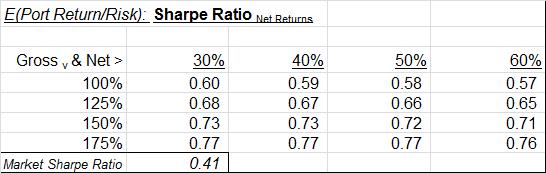
This yields the following net return and risk-based Sharpe ratios:
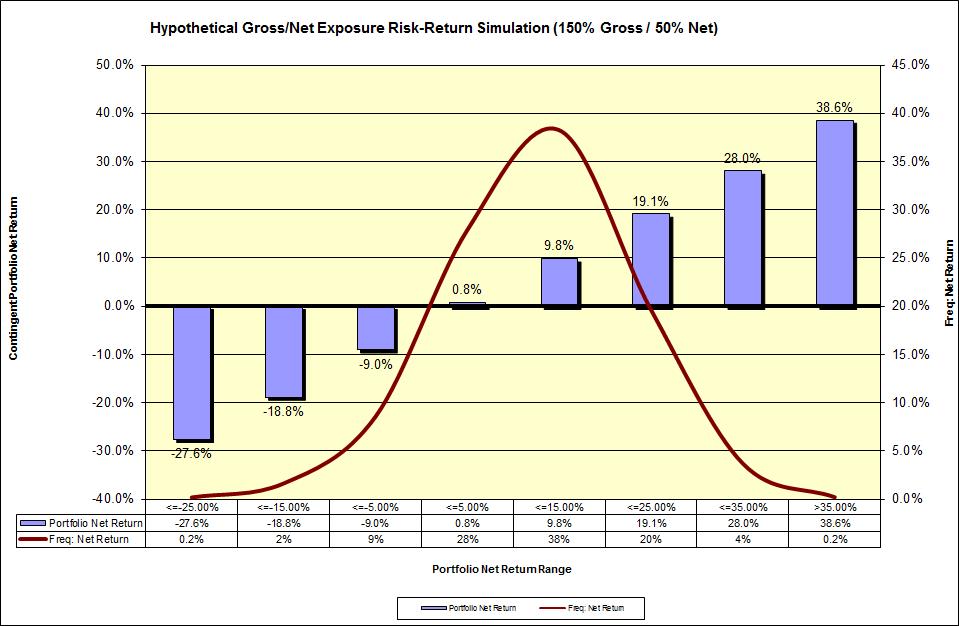
To provide further granularity on the range and frequency of portfolio net returns, and hence volatility, the chart below illustrates this for the 150% gross/50% net combination. The chart reveals a dispersed range of returns with bulk of the returns in the middle return-range buckets. The graphical table also shows contingent expected returns, and frequency, for various return-range buckets.
I used the following assumptions to generate the analysis:
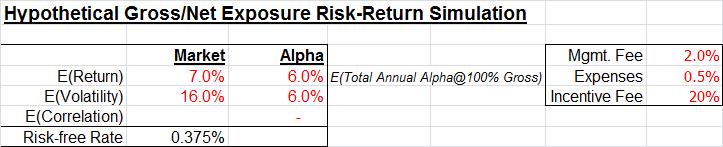
Market:
- expected return of 7% based on a dividend yield of 2.25%, expected nominal GDP growth of 4% and multiple (effectively market earnings growth to nominal GDP growth) of 1.2; expected nominal GDP in turn assumes productivity growth of 1.25%, labor-force growth of 0.75% and expected inflation, per mandate, of 2%.
- volatility of 16% as a MT/LT historical blend
Alpha:
- expected annual alpha of 6% @100% gross (50bps/month @100% gross)
- alpha volatility of 6%
- both broadly corroborated based on past experience and massaged HFRI equity L/S data
- market to alpha return correlation, per construction, of 0
Methodology: I generated 5000 random samples each for the raw market return and alpha return and scaled them by net and gross, respectively, to generate portfolio return, net of all fee, scenarios which in turn were averaged to compute expected portfolio net return and also used to calculate volatility of net returns.
Please note the following caveats:
- this is an exercise fraught with non-trivial noise and many moving parts and dimensions. Any quantitative analysis can at best serve as a starting-point suggestion designed to be qualitatively and dynamically modified, and at worst is dangerous science. This guidepost, along with other related analyses and market barometers may help set the stage to triangulate towards an efficient allocation solution.
- any such “rules” are designed to be broken and dynamically modified based on the evolving, situation-specific market environment
- increasing net, all other things being the same, would probably increase fund correlation with the market, whereas increasing gross exposure, thereby focusing on stock-specific idiosyncratic vol, is probably a higher-quality strategy
- additionally it’s probably better to harness increased gross via a larger number of positions rather than simply increasing position concentration which might magnify the onerous left-tail risk of single-product firms (concentrated –ve alpha episodes)
Note: calculations Risk Advisors, data Bloomberg
Proprietary and confidential to Risk Advisors