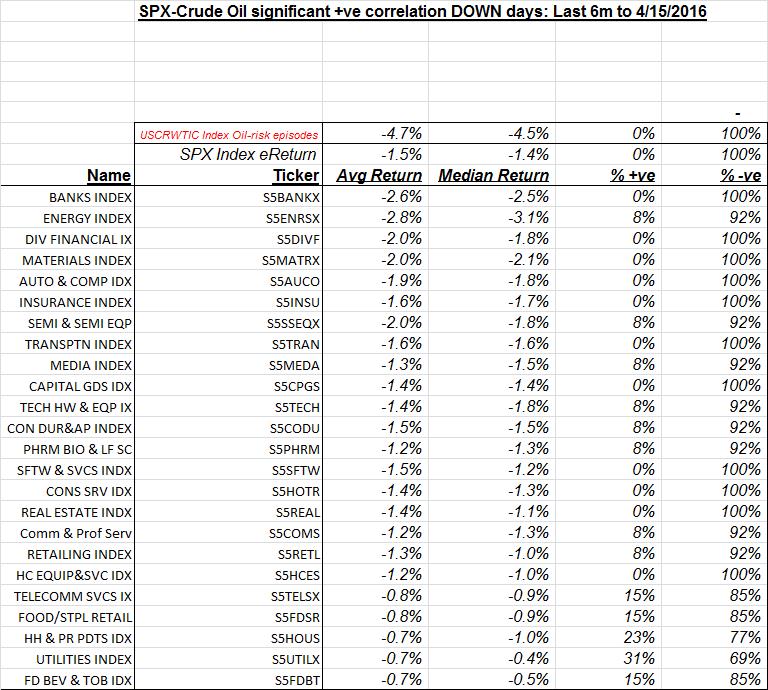
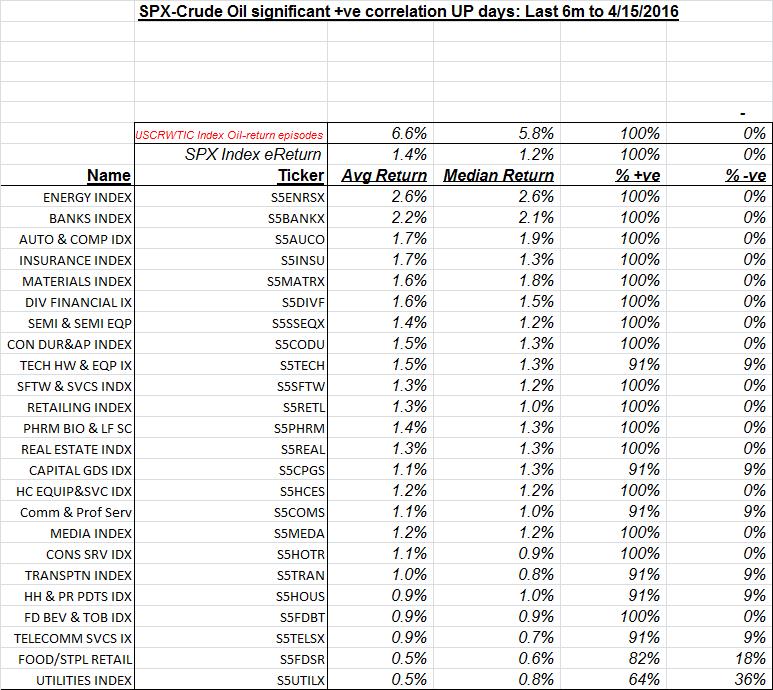
Punch line: over the last 6m the SPX to crude oil relationship has been moderately +ve, albeit somewhat noisily. However, this aggregated data belies the more forceful regime behaviour (+ve correlation pro-cyclical/demand-shock rather than –ve correlation demand-destruction/supply-shock) that has frequently prevailed, in the ST, within this 6m horizon. Focusing on “significant” +ve correlation days (SPX >= +/- 100bp, crude oil >= +/- 250bp) reveals, at the risk of false signals and coincidental correlations, that SPX industries that are consistently more vulnerable to crude oil falling, and more favourably disposed to its rising, include: energy, banks, autos & components, materials, diversified financials and insurance. On the other side of the coin, SPX industries that are consistently less vulnerable to crude oil falling, and less favourably disposed to its rising, include: utilities, food, beverages & tobacco, food & staples retail, household & personal products and telecom services.
Given the Doha impasse and potential for the oil tail to wag the market dog, I updated the SPX to crude oil relationship & SPX industry response over the most recent past in an attempt to discern any convincing regime behaviour: pro-cyclical/demand-shock regime (SPX & crude oil +vely correlated) vs. demand-destruction/supply-shock regime (SPX vs crude oil –vely correlated).
The time-series chart below frames the analysis by tracing the SPX-crude oil moving average correlation over the last 2y.

Telescoping to the most recent 6m, the scatterplot below shows that the dynamic has been moderately +ve, albeit somewhat noisily.
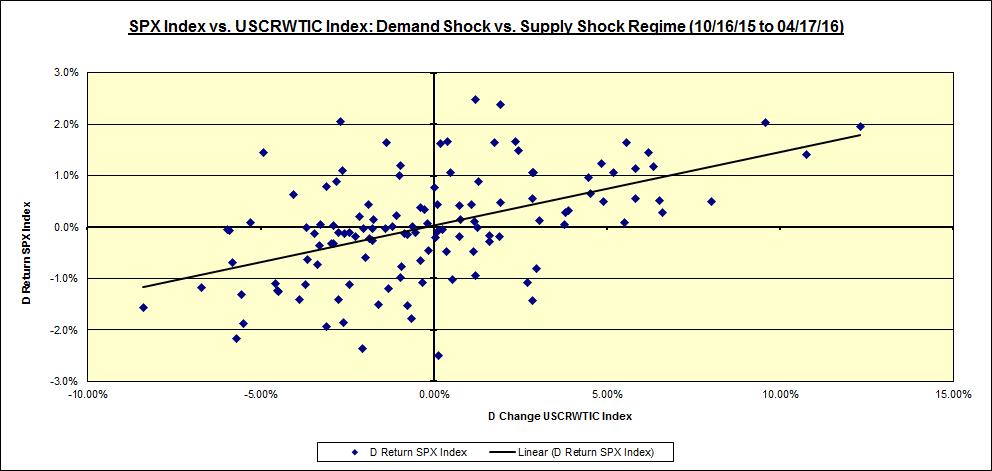
However, this aggregated data belies the more forceful regime behaviour that has frequently prevailed, in the ST, within this 6m horizon. The chart below superimposes the most forceful instances of ST regime behaviour via their piece-wise regression lines, statistical-significance notwithstanding. The brown line reflects the +ve correlation pro-cyclical/demand-shock regime prevalent during the 10d ending 01/28/16 (correlation +0.8) and the green line depicts the –ve correlation demand-destruction/supply-shock regime prevalent during the 10d ending 01/13/16 (correlation -0.4).
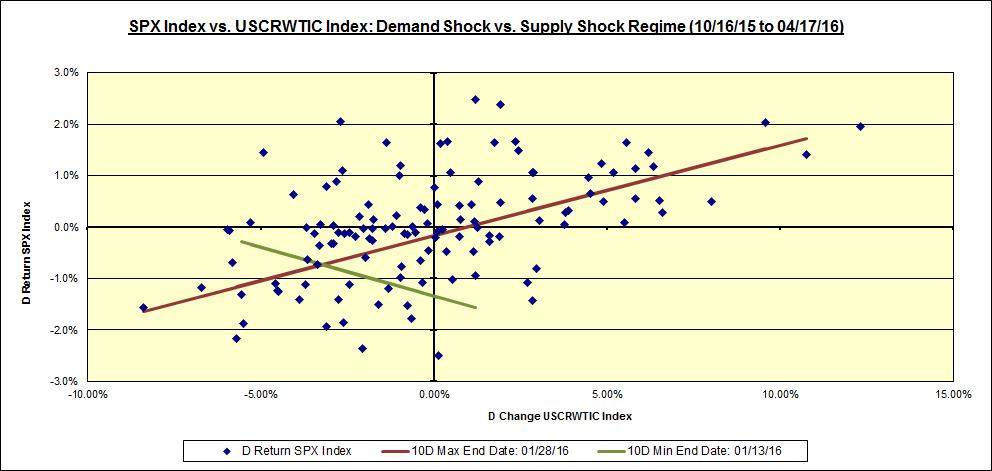
As one might expect given the late 2015/early 2016 market schizophrenia around China, oil/commodities, $, disinflation etc., over the last 6m the +ve correlation pro-cyclical/demand-shock regime has occurred more forcefully than the –ve correlation demand-destruction/supply-shock regime (despite unshackled Iran flooding the market with supply). Indeed, as illustrated in the table below, using 10d non-overlapping windows over the last 6m, the 3 most +ve episodic 10d correlations have occurred much more vigorously than the tepid and sparse –ve correlation episodes.

This message is further reinforced using “significant” SPX-crude oil days: SPX >= +/- 100bp and crude oil >= +/- 250bp. The chart below illustrates that the +ve correlation pro-cyclical/demand-shock quadrants: quadrant 1 with higher SPX and higher crude oil and quadrant 3 with lower SPX and lower crude oil have been much better populated than the sparse –ve correlation demand-destruction/supply-shock quadrants, using the “significant” day criteria.
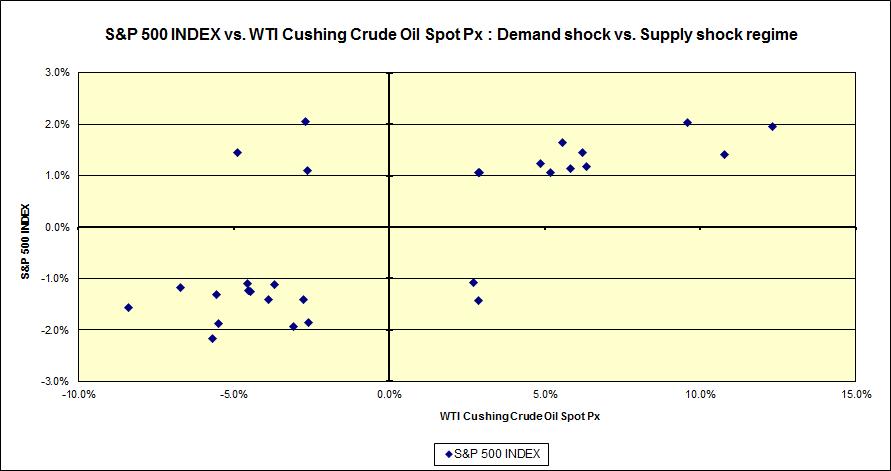
SPX industry response during recent +ve correlation pro-cyclical/demand-shock “significant” days:
Next, I attempted to discern if there were any SPX industries that consistently performed best/worst during these +ve correlation pro-cyclical/demand-shock “significant” days, on both mutually up and mutually down days. These are aggregated using a composite ranking methodology and are reflected in the tables below and noted in the “punch line” above.
Note: calculations Risk Advisors, data Bloomberg
Proprietary and confidential to Risk Advisors
