
Punch line: currently the following S&P 500 sectors are flagged on a relative-value basis:
- mildly rich: info tech
- biased rich: utilities (low-confidence fit), internet index (QNET)
- mildly cheap: biotech index (NBI; low-confidence fit)
The following high-level, trend-adjusted regression analysis may help serve as a rich-cheap relative-value barometer for the S&P500 sector space (along with a few other focused indices), relative to the broad market.
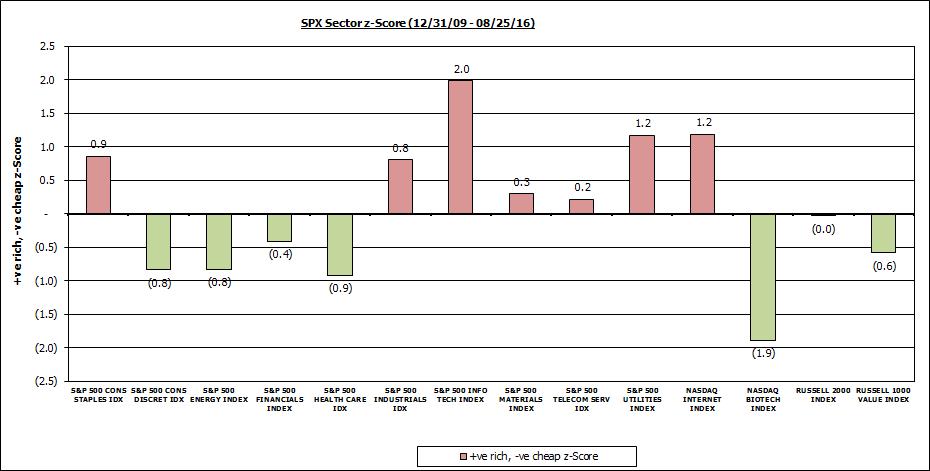
Currently, as reflected in the chart below and in more detail in the attached pdf, the following sectors are flagged on a relative-value basis:
- mildly rich: info tech
- biased rich: utilities (low-confidence fit), internet index (QNET)
- FV zone, richer end: consumer staples, industrials
- FV zone, cheaper end: consumer discretionary, energy (low-confidence fit), healthcare, Russell 1000 value
- mildly cheap: biotech index (NBI; low-confidence fit)
By regressing each S&P 500 sector, adjusted for trend drift, on the S&P 500 index one can solve for the current richness/cheapness of the sector, relative to the market, expressed as a z-score. Also shown are:
- min/median/max z-score thresholds over regression window to provide contextual reference
- goodness-of-fit measures to ascertain confidence in the relationship
- graphical time series of each sector regression-based z-score
Caveats:
- high-level rudimentary in-sample regression analysis susceptible to misspecification, alternate drivers and environmentally-pertinent dynamics
- these can be very noisy relationships and risk highlighting false signals, using different time horizons can produce vastly different signals and this specification doesn’t purport causation
- sector regressions with low return correlation, high standard error, low t-stats indicate noisy, low-confidence relationships
- fundamental rationality often takes a back seat to technicals, sentiment and fund flows i.e., relationships can stay at outlier states for extended time periods (thereby tending to FV as time elapses and regression betas and/or regimes change)
By design, this is a 35k’ broad-brush assessment to help telegraph potential extended sector behavior, which may help serve as a platform for further detailed investigative work.
Note: calculations Risk Advisors, data Bloomberg
Proprietary and confidential to Risk Advisors