
Punch line: the following analysis attempts to study the life cycle of a crowded stock and illustrate the potential crowding, or not, of a few recent high flyers (S&P 500 metals & mining index: alpha-failure phase; S&P oil & gas storage & transportation index: alpha moderation/marking-time recently; AMAT: alpha moderation/marking-time recently, though last 10d boost; WYNN: alpha-failure phase; ZION: alpha-acceleration phase)
“Crowding” is a topically fashionable style barometer and, deservedly so, given its prescience in sniffing out under-performing stocks, false-negatives notwithstanding.
The following analysis attempts to study the life cycle of a crowded stock and illustrate the potential crowding, or not, of a few recent high flyers.
Crowding life-cycle hypothesis:
- Phase 1 (alpha acceleration): the process of becoming a crowded stock can be very profitable and facilitate the harvesting of extraordinary gains. Stocks typically display “+ve beta convexity,” in an accelerating fashion, during this phase as they tend to outperform their betas (rising more/falling less than their betas would suggest in an up/down market) which enables them to cumulate alpha at an increasing rate.
- Phase 2 (alpha moderation): alpha accumulation continues though at a less torrid pace as they garner wider attention and the expectations for outperformance become more cemented.
- Phase 3 (alpha failure): once these stocks capture the collective imagination of the market, they tend to start performing in line with their betas thereby ceasing to accumulate additional alpha and finally, becoming over-owned consensus longs, set themselves up for failure by displaying “-ve beta convexity” whereby they tend to underperform their betas (rising less/falling more than their betas would suggest in an up/down market) causing them to bleed alpha.
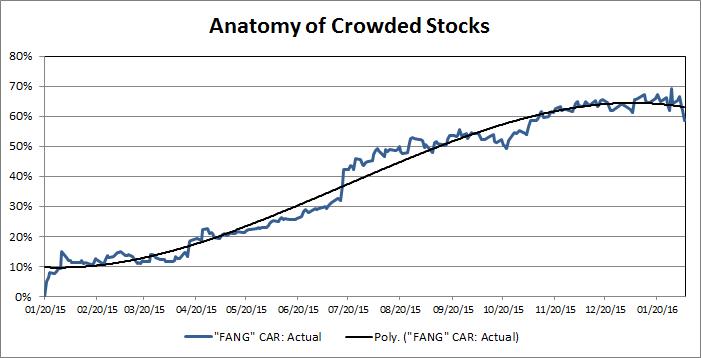
Crowding life-cycle illustration:
The “FANG” stock (FB, AMZN, NFLX, GOOGL) performance of 2015 presents a poster-child specimen of the life-cycle dynamics of crowding. The chart below illustrates the cumulative abnormal return (“CAR”; summation of daily beta-adjusted excess return) over the 01/20/2015 to 02/05/2016 horizon. As depicted by the fitted curve: alpha generation accelerated thorough mid-year, continued at a less frenetic pace through the fall, marked time through the winter, finally turning negative in early 2016.
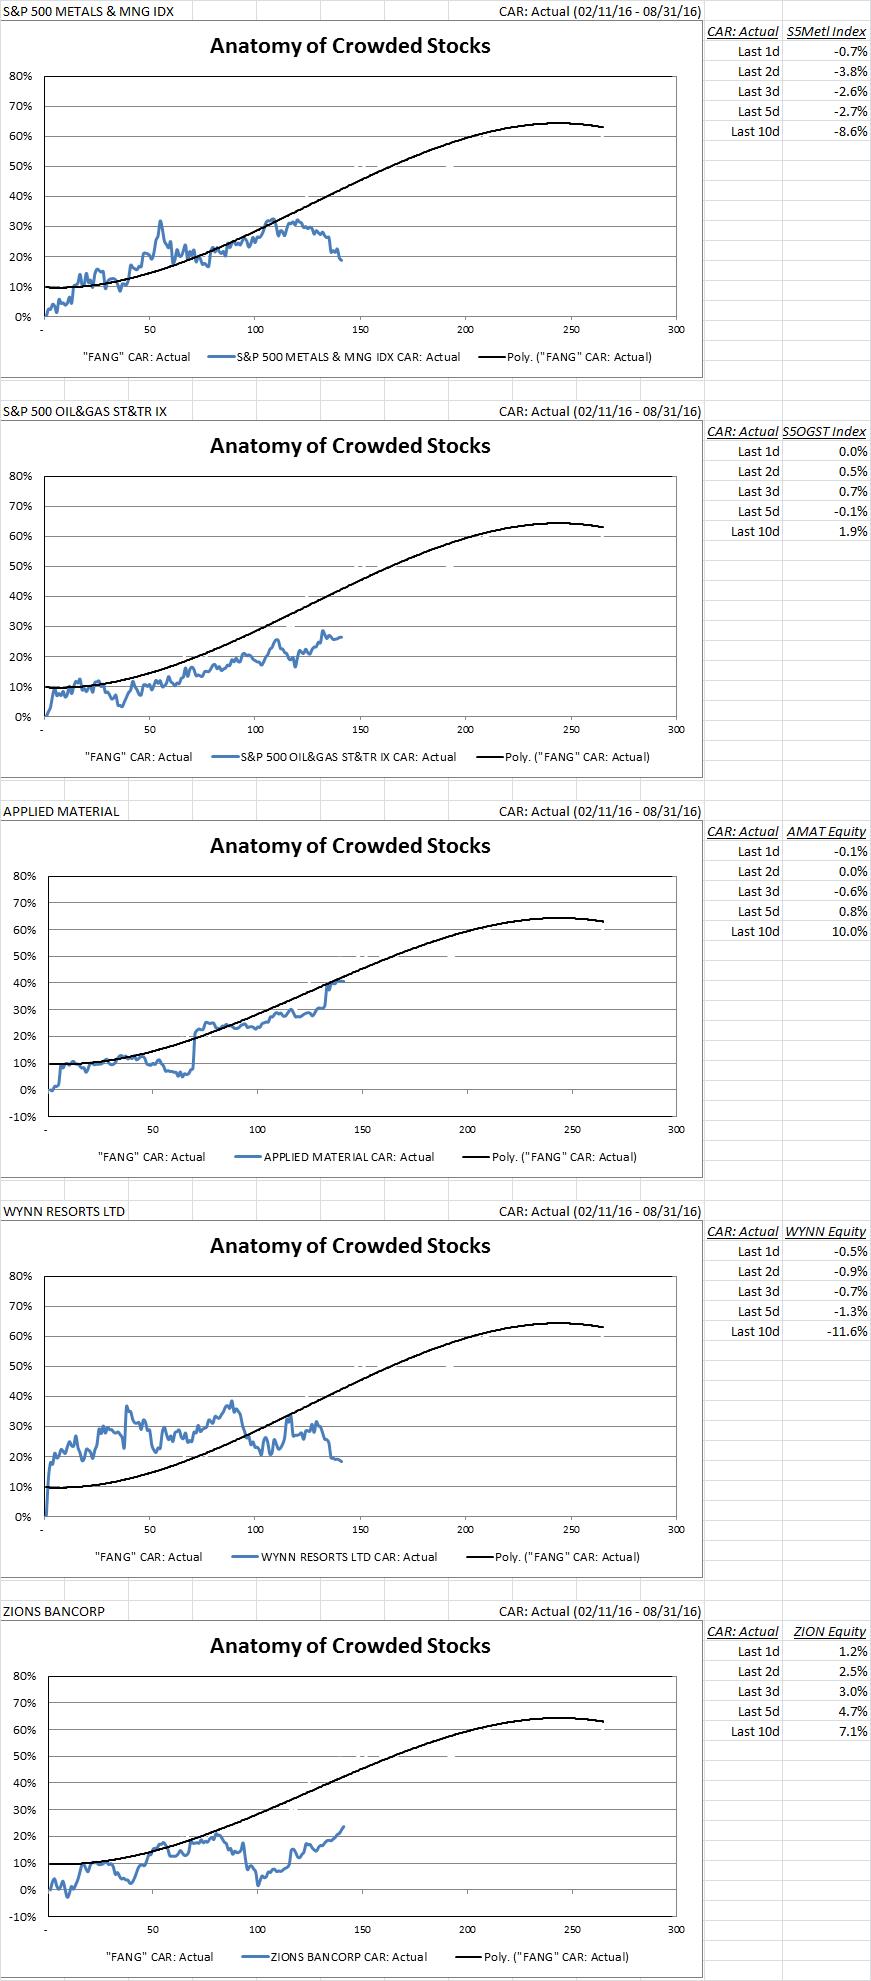
Recent crowding dynamics:
The following charts present the crowding life-cycle dynamics of 5 recent high flyers (02/11/2016 market nadir to date) superimposed with the “FANG” fitted curve by way of a baseline boundary threshold. Also shown alongside is their most recent “CAR” trend in an attempt to discern the crowding phase (at the risk of transmitting false signals).
A few comments:
- S&P 500 metals & mining index: alpha-failure phase
- S&P oil & gas storage & transportation index: alpha moderation/marking-time recently
- AMAT: alpha moderation/marking-time recently, though last 10d boost
- WYNN: alpha-failure phase (post-analysis Macau data point contravening alpha blight)
- ZION: alpha-acceleration phase (post prior alpha-failure phase highlighting evolving and tenuous nature of crowding-related alpha dynamics)
Note: calculations Risk Advisors, data Bloomberg
Proprietary and confidential to Risk Advisors