
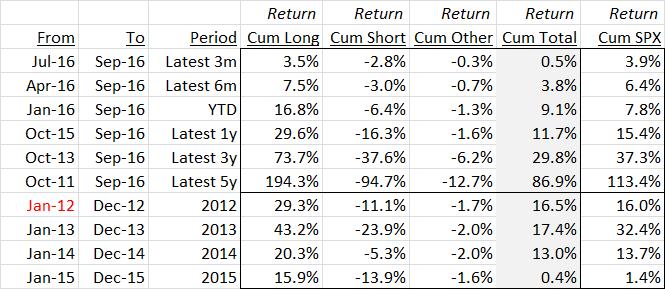
Punch line: the following illustrative analysis decomposes high-level fund returns into active alpha- and passive beta-based components. It utilizes fictitious top-level monthly long and short, returns and exposures, which are typically provided to investors on a monthly basis.
As a general principle, return decomposition analysis can cut the return pie in many different ways but once the slices are put back together they should yield the original return pie.
The following analysis decomposes high-level fund returns into active alpha- and passive beta-based components. It utilizes fictitious top-level monthly long and short, returns and exposures, which are typically provided to investors on a monthly basis, and are summarized below over a variety of time horizons:
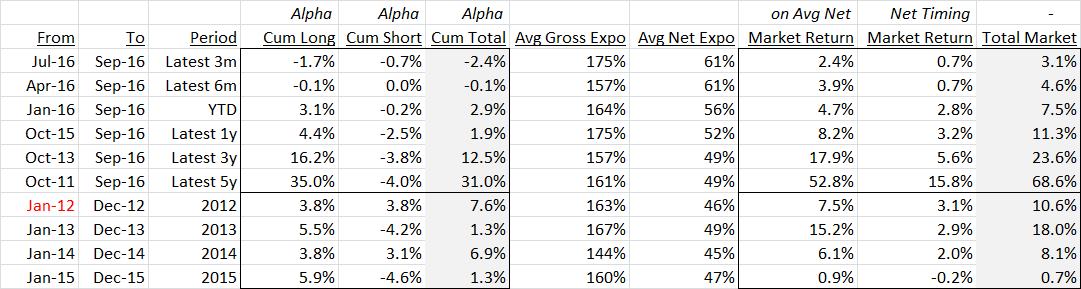
The next table splices returns into alpha and beta components:
- Stock-selection alpha
- Market return on average net exposure
- Market timing return due to net exposure variation/timing
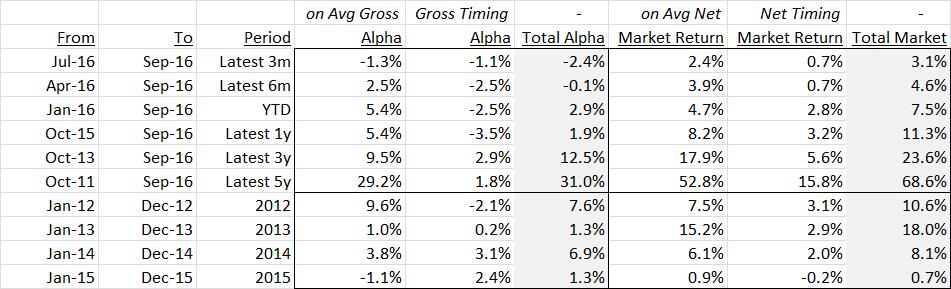
As a broad overarching principle, net exposure earns market return and gross exposure garners alpha. This is reflected in the table below which decomposes returns into:
- Alpha on average gross exposure
- Alpha due to gross exposure variation/timing
- Market return on average net exposure
- Market timing return due to net exposure variation/timing
Finally, the following table further parses alpha generation on average long and short exposure and variation/timing thereof:
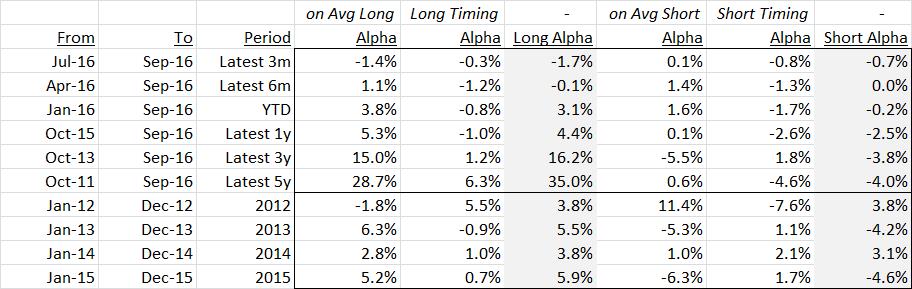
In each of these decompositions, collapsing the component daisy chain yields the periodic total return, thereby ensuring component additivity to composite return.
And, very finally, listed below are the salient features underlying this return decomposition methodology. Essentially, the philosophy is that exposure can be invested actively in the actual stocks selected or passively in the benchmark index; alpha seeks to measure the value added of the former over the latter.
Alpha: consider long exposure by way of illustration. Step 1 is to determine the contribution of long positions to total fund return. This is essentially total long P&L for the period divided by beginning-of-period capital (appropriately adjusting for infusions and withdrawals). Step 2 is to determine the “level-playing-field” benchmark return. This becomes somewhat tricky as exposure is dynamic and changes due to trading and not merely P&L effects. The approach taken is to compute the hypothetical P&L that the long exposure would have earned had it been invested in the benchmark index instead of the actual stocks selected (beginning long exposure*benchmark return). This is then cumulated over the same time horizon to determine the hypothetical benchmark contribution to fund return. The difference between these two numbers is the cumulative, exposure-weighted return differential, or “alpha,” for the period under consideration.
Market-timing return: this seeks to quantify the return from having a dynamic net exposure allocation to the market vs. having a constant net exposure allocation to the market, which is the average net exposure for the time horizon detailed; it is instructive to note that this average net exposure is not known ex-ante but effectively represents the average accumulation of dynamic exposure response to the market as information unfolds. Alpha due to gross, and long and short, exposure variation is computed similarly.
Component return additivity: this methodology performs a full algebraic expansion of the compound component return series which ensures components are additive to the total, in contrast to a simple addition of individually compounded component returns which produces slippage.
(Note: in different venues, data permitting, I use granular daily data and parse down to the sector level, resulting in finer component estimation.)
Attached below is a pdf link to the fictitious return and exposure data used in this analysis.
Note: calculations Risk Advisors, data Bloomberg
Proprietary and confidential to Risk Advisors