
Punch line: the following analysis showcases a user-modified mean-variance optimization framework using Hedge Fund Research (“HFR”) indices to construct an “optimal” hedge-fund strategy allocation. The efficient allocation seeks out high Sharpe ratio, lower volatility and correlation strategies which implicitly emphasize alpha over beta highlighting a moderate gross/mild net construct.
The following analysis showcases a user-modified mean-variance optimization framework using Hedge Fund Research (“HFR”) indices to construct an “optimal” hedge-fund strategy allocation.
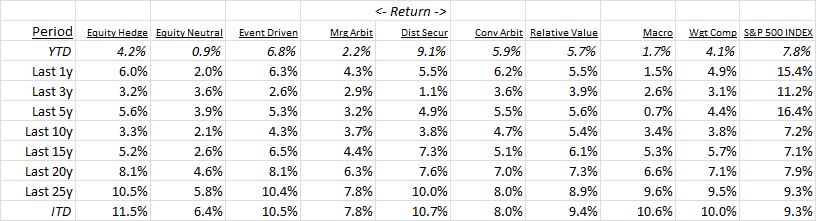
To set the stage, the following table displays hedge fund strategy returns over a variety of time horizons (inception Jan 1, 1990; ending Sept 30, 2016; YTD actual, else annualized return):
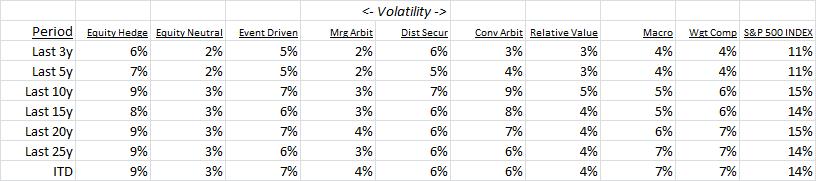
Next, annualized volatility:
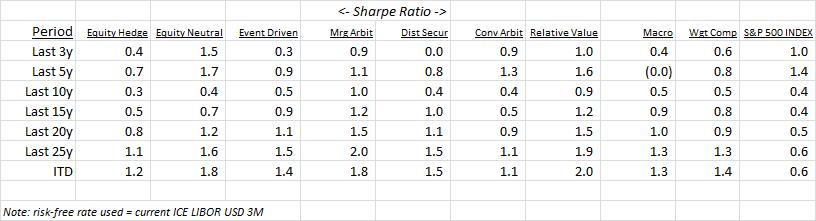
Followed, by Sharpe Ratio:
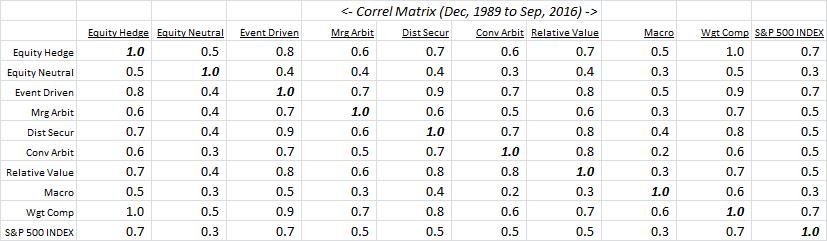
Finally, correlation:
“Optimal” Allocation:
As a preface, this is an exercise fraught with non-trivial noise and many moving parts and dimensions. Any quantitative analyses can at best serve as a starting-point suggestion designed to be qualitatively and dynamically modified, and at worst is dangerous science. The quantitative guideposts below may help triangulate towards an efficient allocation solution:
Using a traditional historical risk-return based mean-variance optimization, subject to max/min participation constraints, yields the following optimal allocation (max portfolio Sharpe ratio):
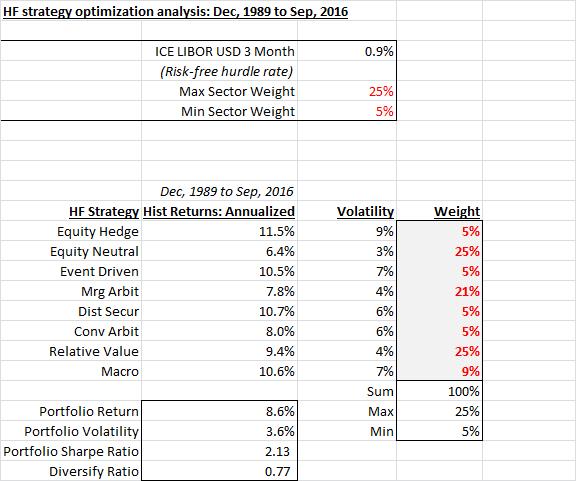
Essentially, the allocation pushes towards the boundary participation constraints with high historical Sharpe ratio and lower-correlation strategies embraced and others shunned.
One of the many weaknesses of traditional historical mean-variance solutions is the use of historical returns which can severely handicap the analysis (more on this below**). In order to address this and provide a forward-looking perspective I introduce the following innovations:
- ex-ante unbiased risk-adjusted return expectation: constant baseline Sharpe ratio across strategies of 0.4 (broadly consistent with Ibbotson’s ultra long-term risk premium)
- incremental alpha component:
- expected total annual alpha, fully invested, of 6%
- alpha’s beta scales base alpha of 6% by a beta factor which is a qualitative adjustment to reflect propensity, past and future expectation, to generate incremental value added
Using a simulation-based optimization methodology, subject to max/min participation constraints, yields the following optimal allocation (admittedly contrived, via alpha’s beta and co-variance matrix horizon, to highlight differential allocation):
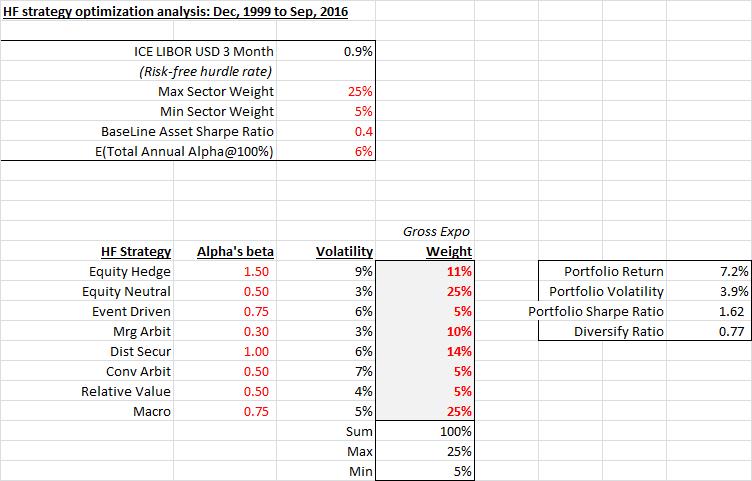
Once again, the allocation largely pushes towards the boundary participation constraints.
It should be noted that actual fund risk-return profiles can be substantially different from the strategy averages used. Additionally, the efficient allocation seeks out high Sharpe ratio, lower volatility and correlation strategies which implicitly emphasize alpha over beta highlighting a moderate gross/mild net construct.
**One of the soft underbellies of traditional mean-variance optimization solutions is the use of historical returns which tends to severely handicap the analysis (historical return may have no bearing on future return expectation; indeed, one may be long/short a historically under/out performing asset which might make optimization results stand on their head relative to future expectations). An unbiased innovation to address this is to rely on arbitrage logic that ex-ante all assets have the same expected risk-adjusted return (else the market would move into higher risk-adjusted return investments and away from lower risk-adjusted return investments so that in equilibrium all had equivalent risk-adjusted returns). Clearly, this proposition is more defensible over the long term and less granular level; hence, the incremental alpha and alpha’s beta value-added terms to subjectively qualify returns.
Please note the following, amongst other, caveats, qualifications and risk-factors:
- optimization results are horribly unstable and one may arrive at vastly different solutions by varying time horizons and co-variance matrices; additionally, they suffer from the “egg-crate” problem where slightly sub-optimal solutions may have more intuitively-appealing results
- these guideposts, along with other related analyses and market barometers such as implied/realized correlation, dispersion, residual/specific risk etc., may help triangulate towards an efficient allocation solution
- any such “rules” are designed to be broken and dynamically modified based on the evolving, situation-specific market environment
Note: calculations Risk Advisors, data Bloomberg
Proprietary and confidential to Risk Advisors