
Punch line: extreme episodes of UST10y rates rising with the MSCI EM concurrently selling off, a potential risk scenario, has EM healthcare as a consistent outperformer; recently, EM real estate and EM financials have been notable underperformers. In the SPX space, financials used to be a notable underperformer, trading as a long-duration asset, until the GFC period; following which its largely been an outperformer. Real estate has been a consistent underperformer and recently telecom services, utilities and consumer staples have also been tarred by the long-duration brush.
With the upending of the status quo and the attendant profound uncertainty, I attempted to parse history, admittedly awkwardly, for a relevant playbook. Given the potential for fiscal stimulus and the rhetoric surrounding trade protectionism, I harvested environmentally-pertinent, macro-contingent dynamic stress episodes; specifically, UST10y selloff episodes accompanied by MSCI EM drawdowns. (SPX impact likely buttressed by fiscal stimulus and buffeted by a higher rate structure.)
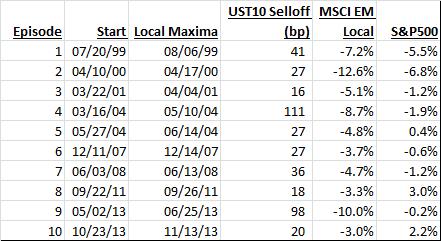
The pdf link below, enumerates MSCI EM drawdown, and sector response, within extreme UST10y selloff episodes (Jan 1, 1997 to date; blacking out Sept 1, 2008 – March 31, 2009 eye of the GFC storm), subject to a modified low-water mark. Since not all UST10y selloffs show MSCI EM losses (e.g. risk-on) and more often than not the max MSCI EM drawdown occurs before UST10y peaks, I truncated the UST10y selloff episodes at the date of the max MSCI EM drawdown (scenario-generation mechanics illustrated below**). Further, I only selected episodes where the MSCI EM returned <= -3% and UST10 sold off >= 15bps; this yielded 10 extreme joint episodes, shown below:
Shown are the MSCI EM sector statistics (as well as SPX sector), ranked best to worst, for each of the 10 identified episodes. As the scenarios are quite disparate, it may be more meaningful to focus on environmentally pertinent episodes.
**To illustrate the episode generation process consider the following e.g.: local UST10 selloff episode (May 2, 2013 – July 5, 2013): 111bps; max MSCI EM drawdown occurred on June 25, 2013: -10%. UST10y selloff to June 25, 2013: 98bps; since MSCI EM <= -3% and UST10y selloff > 10bps, this represents a joint extreme episode scenario.
Note: calculations Risk Advisors, data Bloomberg
Proprietary and confidential to Risk Advisors