
Punch line: the following expose displays a time-series analysis of the macro asset-class correlation regime (equity, rates, currency and commodity) and presents a qualitative hypothesis of macro regime evolution.
The shifting sands of equity (S&P 500), rates (UST 10y), currency (DXY) and commodity (gold) macro asset-class correlation regime can be noisy, fickle and tenuous; displaying elements of technical noise, cyclical regime change and time-varying secular trend.
The following expose displays a time-series analysis of the macro asset-class correlation regime (Jan 1, 2010 to date; post GFC drawdown and aftermath) and presents a qualitative hypothesis of macro regime evolution.
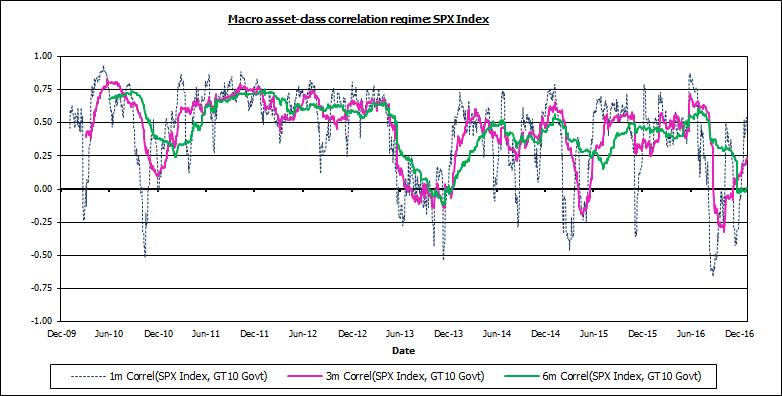
The first three graphs chart the 1m, 3m and 6m correlation of the S&P 500 with UST 10y yields, DXY and gold, respectively. The equity-rate correlation has largely been positive reflecting the risk-premium/growth-flavored regime where the two have largely moved in tandem, notwithstanding the occasional duration/policy-driven regime punctuation where equity has fleetingly traded as a traditional long-duration asset.
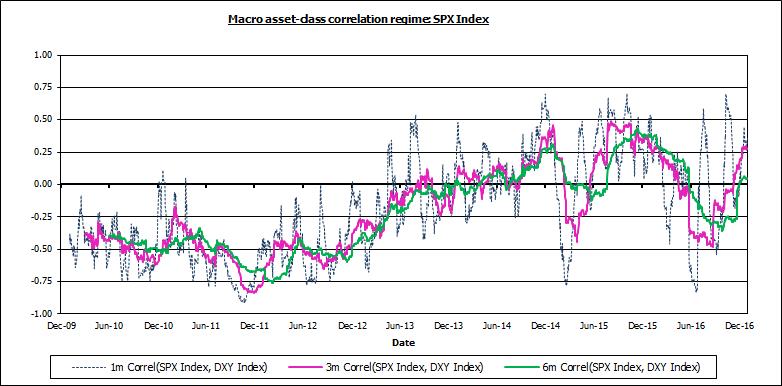
The equity-currency correlation was initially –ve reflecting risk on/off and trade/currency-translation dynamic but later turned +ve as growth drove equity and rates in tandem and currency followed rates on interest-rate differentials.
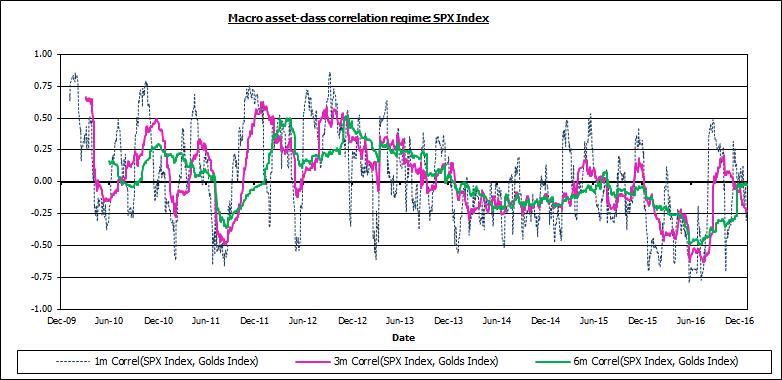
The equity-gold correlation has been fairly choppy with the precious metal trading both as a safe-haven –vely correlated asset, as well as displaying a pro-commodity cyclical impulse trading +vely with risky assets.
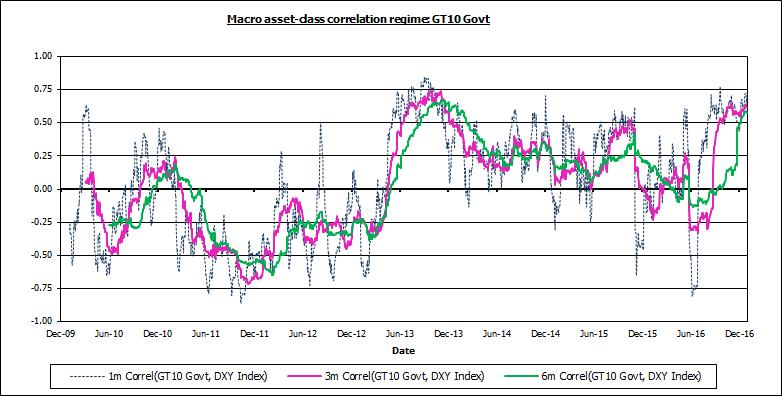
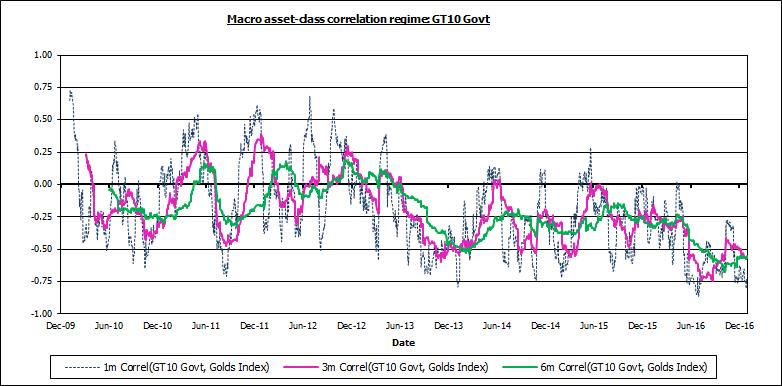
The next two charts trace the correlation between the UST 10y yield and the DXY and gold, respectively. Flight-to-quality wrought –ve rate-currency correlation, while growth-predicated rate-differential dynamic prompted +ve correlation.
The rate-gold correlation tends to be -ve during risk on/off episodes, mildly +ve during transitional growth phases trading pro-cyclically with commodities and –ve again as rates, the opportunity cost of holding gold, drive gold inversely.
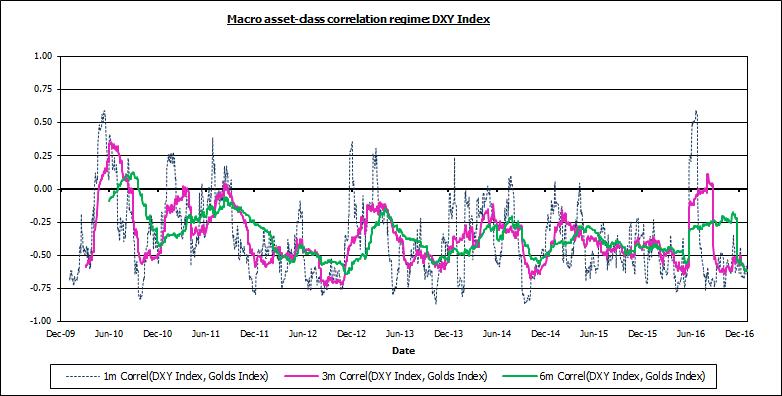
The final time-series chart depicts the currency-gold correlation. Against a more traditional inverse-$ proclivity backdrop, occasional flight-to-refuge episodes spark +ve correlation.
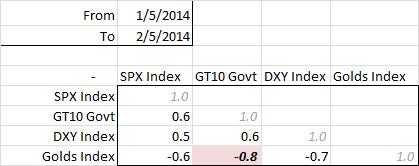
Next, a qualitative hypothesis that seeks to describe macro regime evolution along with actual 1m inter-asset correlation matrices, admittedly choreographed, symbolizing the hypothesized correlation regime:
- classic risk-premium (risk on/off) regime: S&P 500 down/up, rates lower/higher, DXY up/down, gold higher/lower as risk aversion dominates
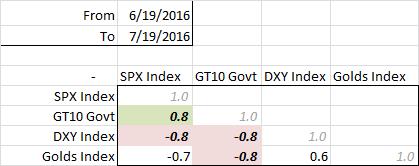
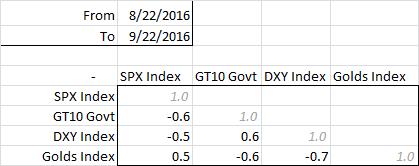
- transition to pro-commodity regime: S&P 500 down/up, rates lower/higher, DXY up/down, gold flips lower/higher on pro-cyclical commodity impulse and inverse-DXY proclivity
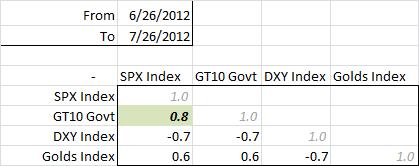
- transition to rate-differential regime: S&P 500 down/up, rates lower/higher, DXY flips down/up on rate differentials, gold flips higher/lower responding inversely to in-tandem rates-DXY impulse
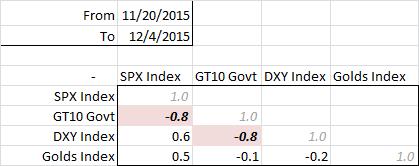
- classic duration/policy-driven regime: rates lower/higher, S&P 500 flips up/down as long-duration asset, DXY remains down/up on rate differentials, gold remains higher/lower inverse to in-tandem rate-DXY signal; in the prior regime ultimately higher rates coupled with a stronger DXY lend to tighter financial conditions which throttles growth expectations and leads to lower equity prices, and vice-versa.
Addendum: global monetary, including QE, stimulus/withdrawal has wrought fleeting instances of “overseas puppeteer duration/policy-driven regime:” rates lower/higher (overseas policy drives, US rates follow suit on gravitational pull), S&P 500 up/down as long-duration asset, DXY up/down on higher/lower relative rate differential, gold mixed as firmer/weaker DXY tugs gold down/up, whereas lower/higher rates prods gold up/down. The 2w ending Dec 4, 2015 manifest this dynamic.
Note: calculations Risk Advisors, data Bloomberg
Proprietary and confidential to Risk Advisors