
Punch line: Given the recent fleeting market wobble, in the midst of a molasses-like volatility environment, and at the risk of being a Cassandra, the following analysis revisits the drawdown experienced by a variety of representative indices.
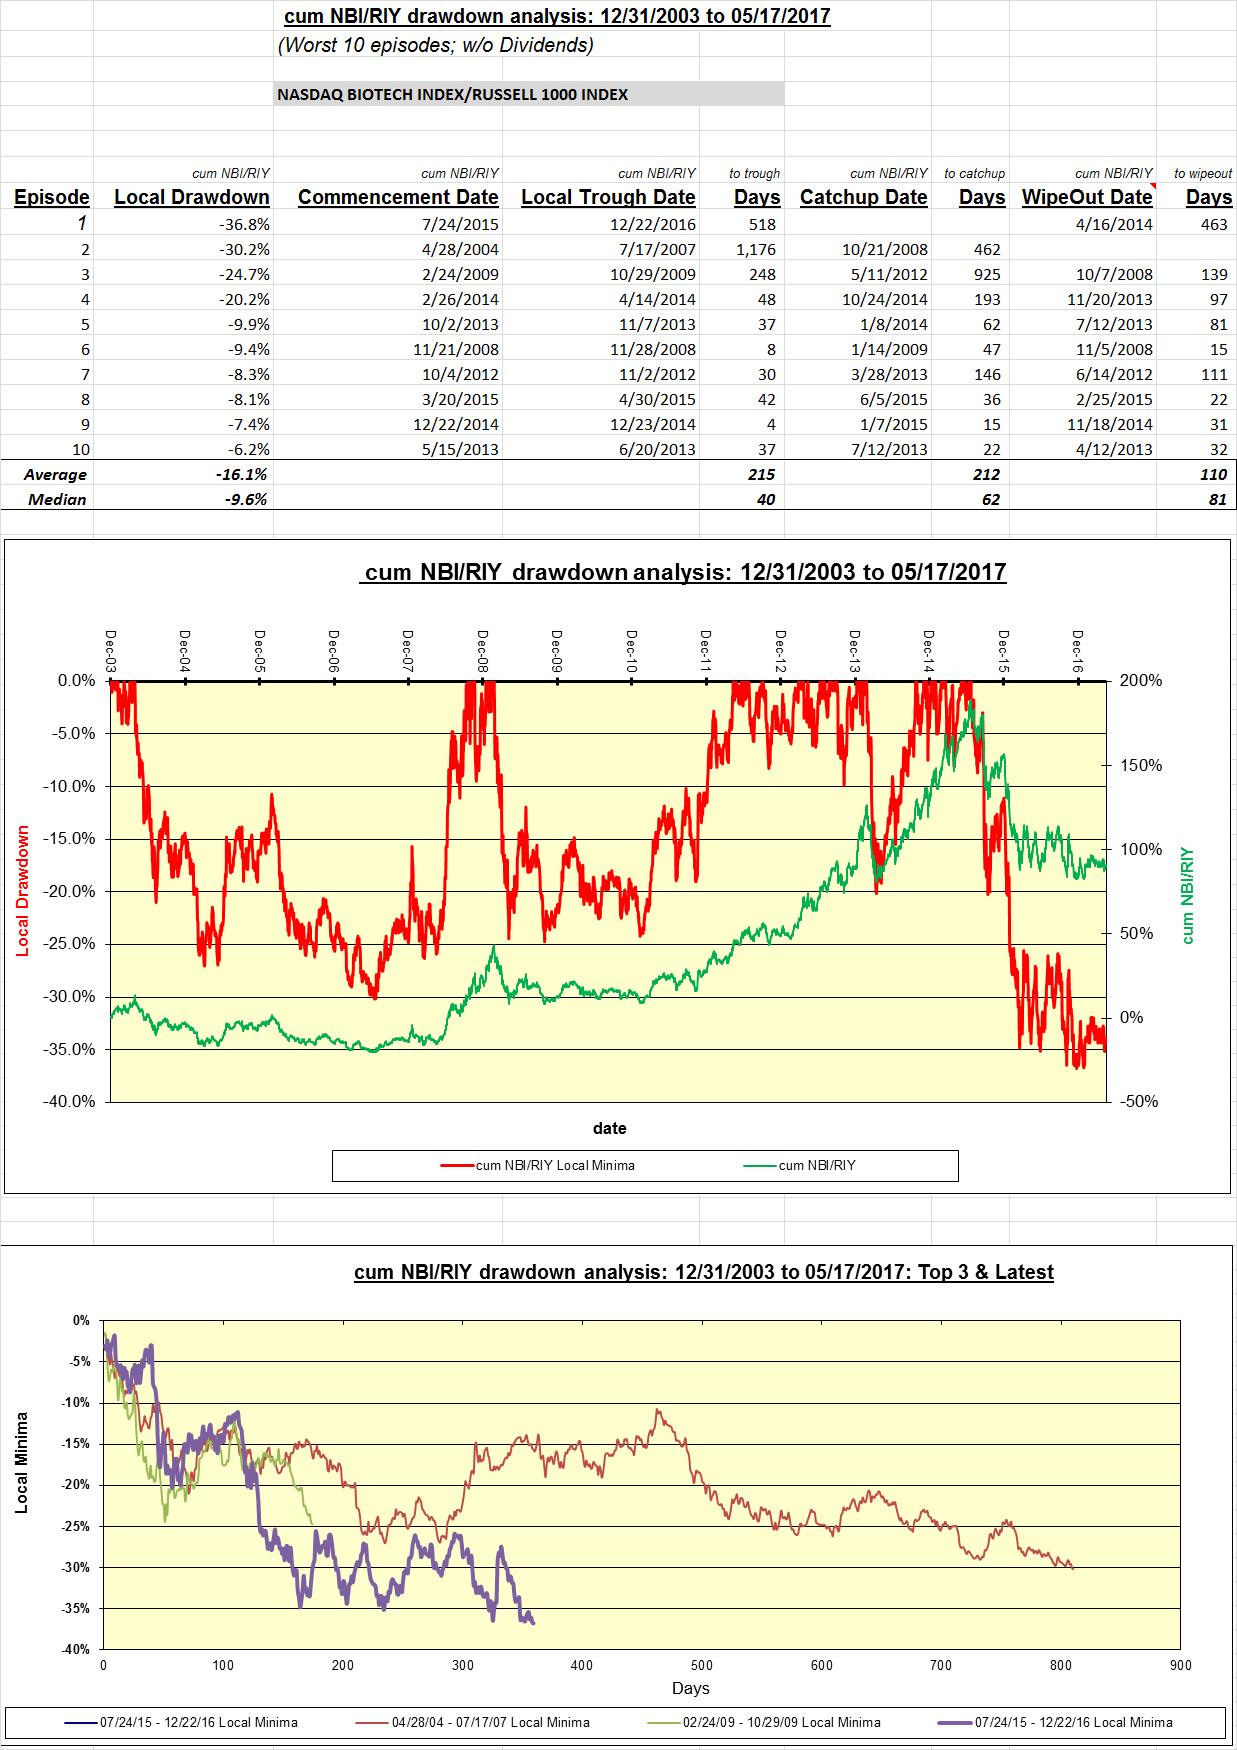
The attached analyses illustrate the drawdown experienced by representative indices and puts them in a historical context (1/1/2004 to date; QNET – R1K 11/28/2007 to date). Illustrated for the NBI – R1K excess return below, and included in pdf form, are analyses for:
NBI_R1K pdf
QNET_R1K pdf
R2K_R1K pdf
GSHFVIP_R1K pdf
MSCIMoM_R1K pdf
Shown are the drawdown returns, the commencement date of the drawdown episode, local trough date when the minimum return was experienced within the drawdown episode, catch-up date when the prior high-water mark was scaled again and wipeout date which essentially states the length of the prior period cumulative return that was extinguished by the drawdown return.
Also, a chart on the drawdown episodes chronologically organized (drawdown in red on left y-axis; cum return in green on right y-axis) followed by a time-aligned time series of the latest and 3 worst drawdown episodes.
While these analyses are strictly based on formal drawdown, where a drawdown episode ends only when the trailing high-water mark is scaled, in other venues where I study extreme-episode behavior, in order to harvest more and more frequent drawdown episodes, I auto modify the high-water mark when a certain threshold of +ve return is earned following a local minima/trough; this prevents long, protracted drawdown episodes by splitting them into several punctuated drawdown episodes.
Note: calculations Risk Advisors, data Bloomberg
Proprietary and confidential to Risk Advisors