
Punch line: over the past year the SPX-UST10y relationship on average appears noisily marginally +ve. However, this aggregated data belies the more forceful regime behavior (risk-premium: equity-rates directional synchronicity vs. duration-based: equity-rates directional inverse) that has frequently prevailed over this horizon. Further, regime-conditional industry sensitivity was asymmetric for several industries.
Given the prevailing Fed-hike/lower-inflation tension, the following analysis studies the SPX-UST10y relationship over the recent past partitioned by correlation regime: risk-premium (on/off), where equity and rates move in tandem, vs. duration-based, where they move inversely; or growth vs. policy regime.
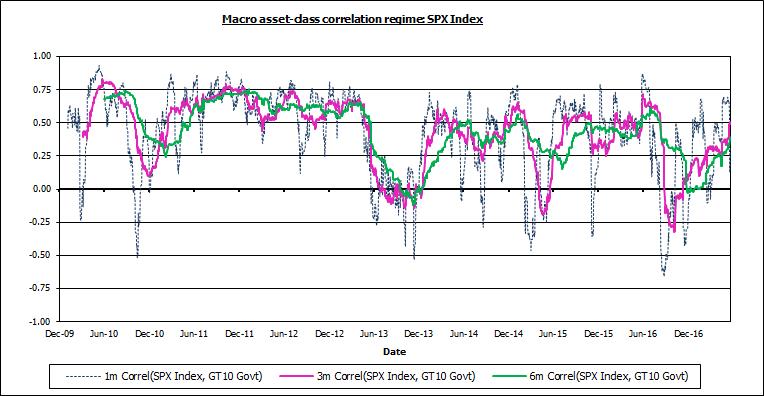
The time-series chart below frames the analysis by tracing the SPX-UST10y moving-average correlation from Jan 1, 2010 to-date (post GFC drawdown and aftermath). The equity-rate correlation has largely been positive reflecting the risk-premium/growth-flavored regime notwithstanding the occasional duration/policy regime punctuation where equity has fleetingly traded inversely as a traditional long-duration asset.
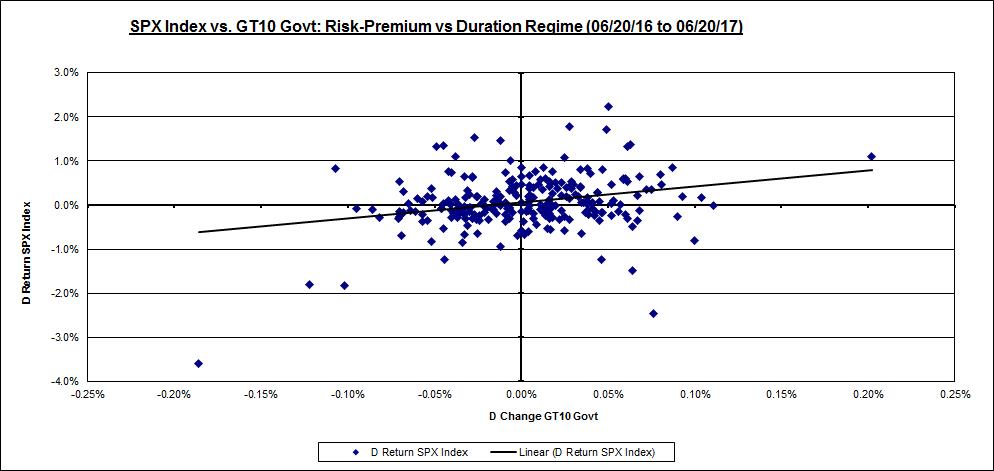
Telescoping to the past year, the scatter-plot below shows that the co-movement dynamic has on average been noisily marginally +ve.
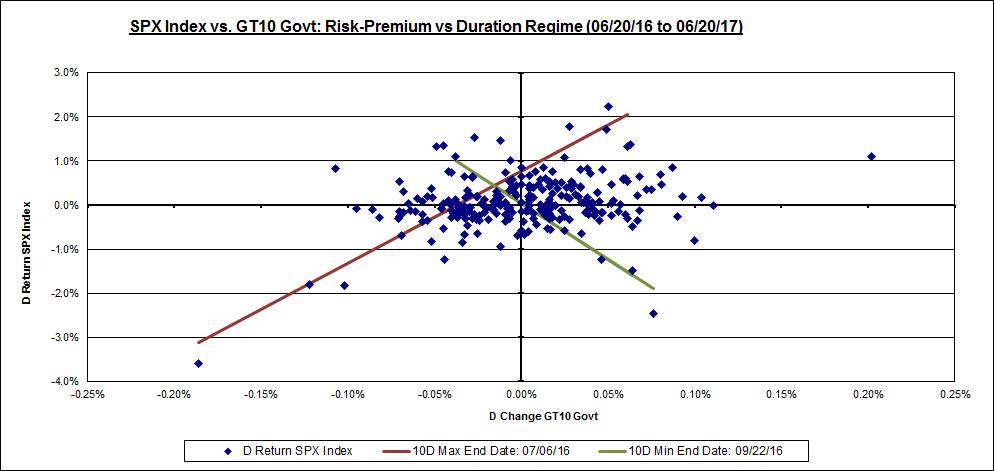
However, this aggregated data belies the more forceful regime behavior that has frequently prevailed, in the ST, over the year past. The chart below superimposes the most forceful instances of ST regime behavior via their piece-wise regression lines, statistical-significance notwithstanding. The brown line reflects the risk-premium regime prevalent during the 10d ending 07/06/16 (correlation +0.9) and the green line depicts the duration-based regime prevalent during the 10d ending 09/22/16 (correlation -0.8).
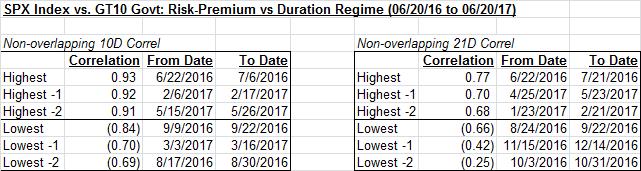
As one might expect given the low growth/quiescent inflation backdrop, the risk-premium regime has occurred more frequently than the duration-based regime. Indeed, as illustrated in the table below, using 10d and 21d non-overlapping windows over the past year, the 3 most +ve risk-premium regime correlation episodes have occurred more vigorously than the duration regime episodes, particularly over the 21d horizon.
This message, of forceful regime episodes beneath an overall noisy hood, is further reinforced using “significant” SPX-UST 10y days: SPX >= +/- 30bp and UST 10y yield >= +/- 2bp (both 0.5-sigma thresholds). The table and chart below illustrate that all four quadrants are well populated although risk-premium days are twice as frequent as duration days.
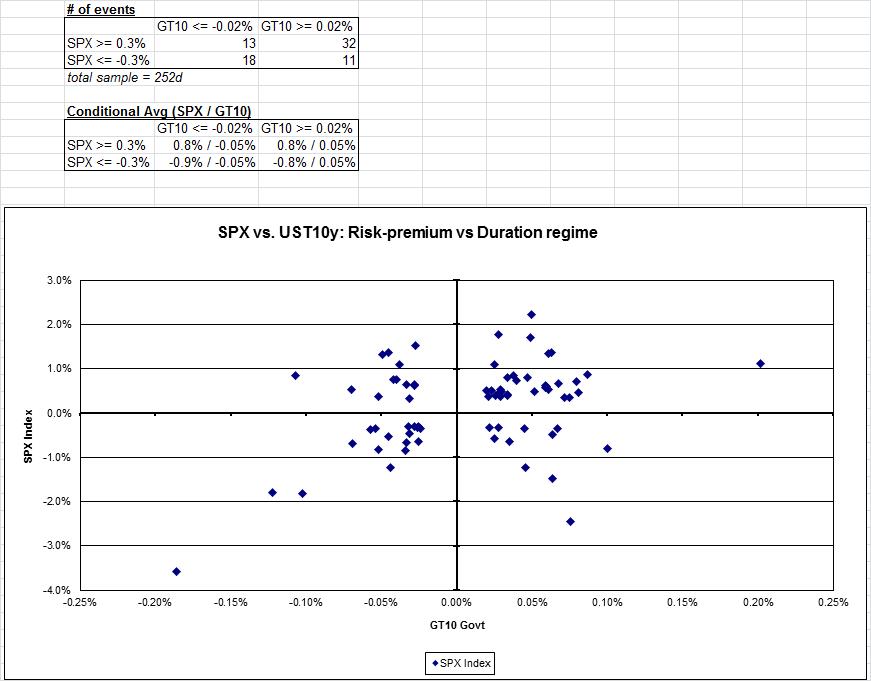
More granular detail is provided in SPX vs UST10y risk-premium vs duration PDF.
Regime- and “significant”-day conditional industry sensitivity:
Next, I looked at the industry sensitivity, as measured by conditional beta, using the “significant”-day criteria and segmented by correlation regime. Majority of industries, as reflected in the body of the chart below, had fairly symmetric betas to UST 10y yields, conditional on the correlation regime. Others, particularly at the wings, had asymmetric relative betas, which highlights that industry sensitivity to UST 10y yields, sign and magnitude (relative and absolute), was contingent on the underlying equity-rate correlation regime. For instance, financials had large +ve growth-regime betas and more muted –ve policy-regime betas, reflecting greater pro-cyclical rate sensitivity in the growth regime. On the other end of the spectrum, defensives had large –ve policy-regime betas and flattish (even –ve) growth regime betas, reflecting greater anti-cyclic (classic duration) rate sensitivity in the policy regime. This is portrayed in the chart below:
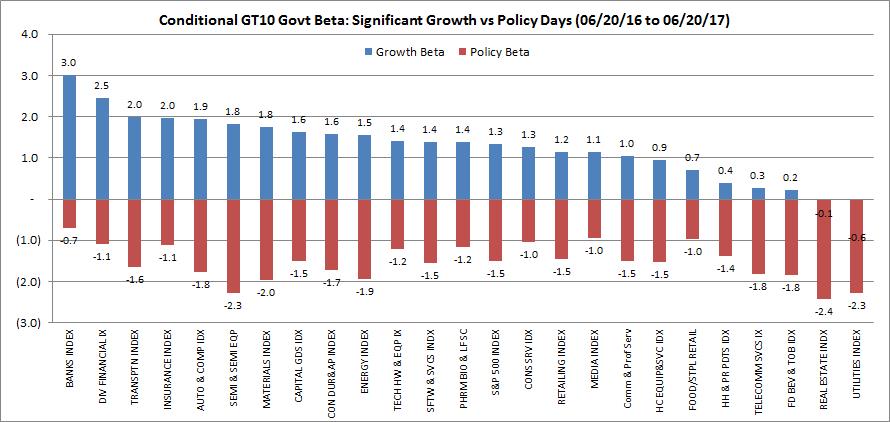
(Note: betas are to yields, not prices, and scaled by a factor of 10 approximating duration)
In summation, this analysis underscores that the equity-rate relationship is fraught with imprecision and enhanced basis risk; not just the magnitude of the sensitivity but the sign as well.
Note: calculations Risk Advisors, data Bloomberg
Proprietary and confidential to Risk Advisors