
Punch line: Q2, 2017 S&P 500 sector returns were mostly firmer contributing to a modest index gain. Sector returns were led by healthcare and lagged by telecom services. Intra-sector stock-returns were well dispersed within the consumer and industrial space, while several other sectors, most prominently financials, sported tighter groupings. These are reflected in the charts and tables below.
The following is an update of the quarterly sector-level dispersion analysis which reveals mostly firmer sector-level performance and varied intra-sector dispersion outcomes:
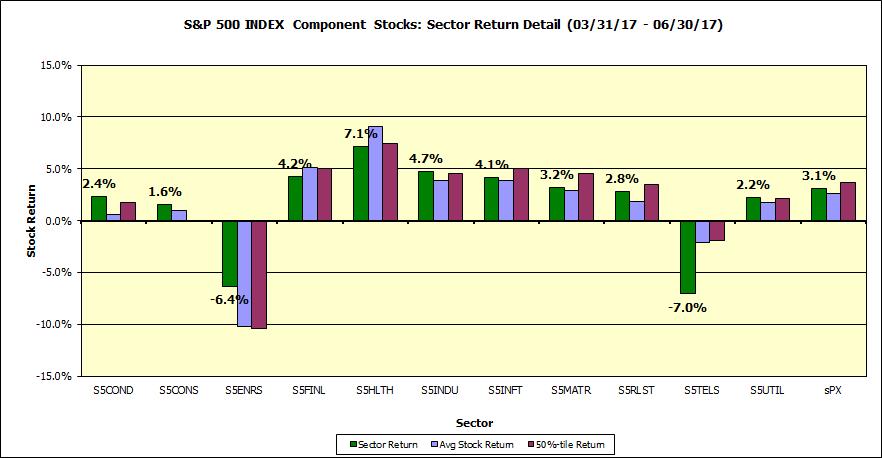
This first chart notes the sector (cap-weighted) return (green bars), average (equally-weighted) return (blue bars) and median stock return (burgundy bars) for the various sector of the S&P 500 over the Q2, 2017 horizon (with dividends, latest constituents). Sector returns were mostly firmer led by healthcare, with telecom services and energy the sole two laggards, again. At the index level, and for several sectors, cap-weighted returns bested equally-weighted returns reflecting large-cap out performance within the S&P 500.
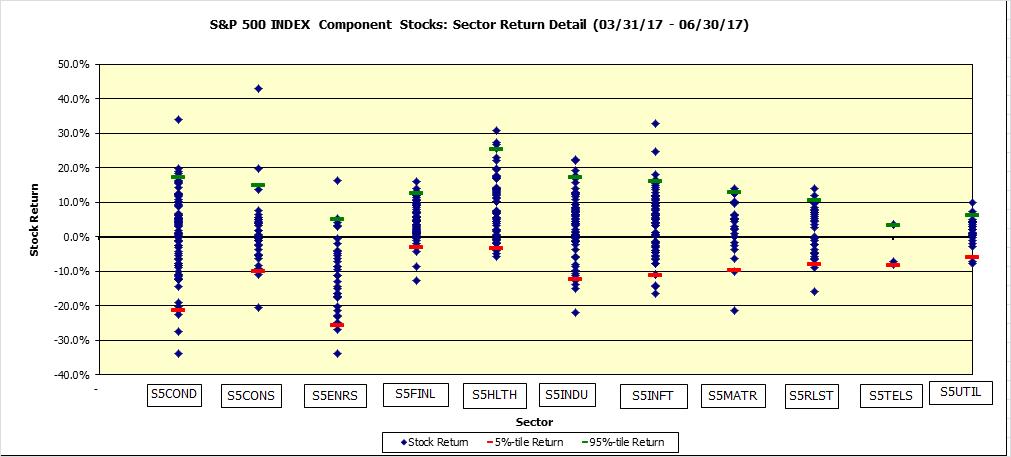
Next, a scatter plot of stock returns by sector, along with 5%- & 95%-tile markers. Intra-sector stock-returns, relative to their volatility, were dispersed within the consumer and industrial space, while several others, most prominently financials, sported tighter groupings. This is visually apparent in the chart below and more precisely in the table that follows.
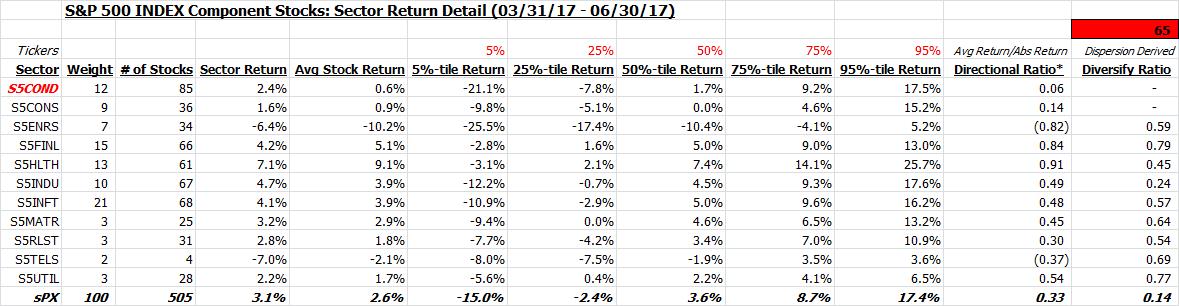
This is also shown in tabular form along with the %-tile sector return distribution. Also shown is the directional ratio (avg net return to avg gross return) and dispersion-based diversification ratio (~ index vol/component vol), both of which point to differential sector outcomes.
Finally, a listing of stock returns, by sector, ranked in descending order of performance is shown in the pdf link below:
Stock by sector returns Q2, 2017 PDF
And, very finally, the cumulative abnormal return (“CAR”; summation of daily beta-adjusted excess return) of the S&P 500 GICS industries, over the Q2, 2017 horizon. I ran the CAR for each S&P 500 industry, sorted them in descending order of outperformance, and then charted the top 10/bottom 10 CAR industries in the below pdf links.
CAR industry BOTTOM Q2, 2017 PDF
Note: calculations Risk Advisors, data Bloomberg
Proprietary and confidential to Risk Advisors