
Punch line: the return-to-trough ratio (“RtT”) attempts to measure return generated relative to maximum pain incurred. Computationally, RtT = return, divided by, worst drawdown. The following table computes the RtT for MSCI EM sectors.
The trailing 5-year (July 31, 2012 – July 31, 2017) return-to-trough ratio (“RtT”) for MSCI EM sectors (local currency), ranked by annualized RtT, is shown below:
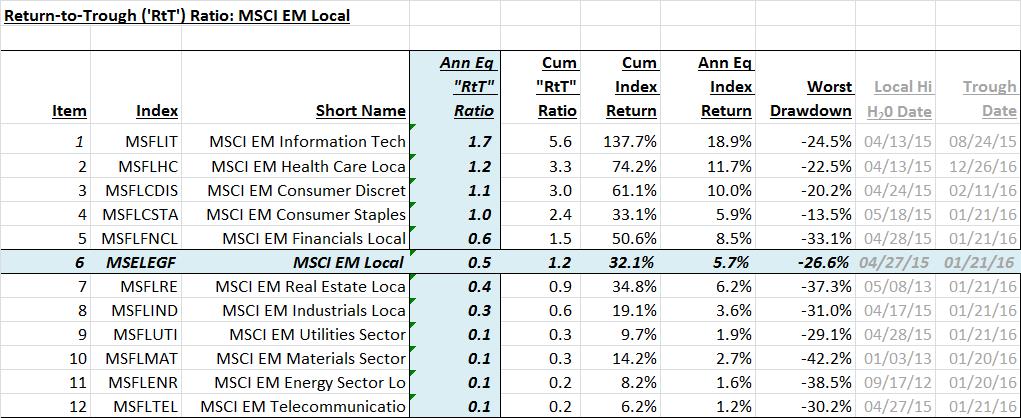
Computationally, RtT = return, divided by, worst drawdown. In its raw form it uses cumulative returns and worst drawdown over the horizon detailed. However, the raw cumulative RtT can be somewhat amplified as horizon length increases as returns cumulate with time while volatility, which begets drawdown, tends to expand with the square root of time. Hence, annual-equivalent RtT, my preferred poison, uses annualized returns in the numerator and worst drawdown, deflated by the square root of the investment horizon, in the denominator. By creating a level-time playing field annual-equivalent RtT can help facilitate comparison; both cross sectional between assets as well inter temporal for the same asset.
For further detail on RtT dynamics please refer to: Return-to-trough ratio: a superior risk-reward metric
Note: calculations Risk Advisors, data Bloomberg
Proprietary and confidential to Risk Advisors