
Punch line: inter-stock correlation has rarely been lower, providing a propitious stock-picking environment. Consumer, healthcare and info tech stocks represent auspicious alpha-propensity sectors given their higher stock-specific idiosyncratic risk.
It could be a fortune-cookie prophecy: may you live in in-volatile times!
With volatility plumbing life-time lows and commensurately-depressed average-correlation providing a fertile stock-picker canvas, the following analysis provides some historical context.
The chart below traces the average stock volatility and inter-stock correlation for the Russell 1000 stock universe over the mid-term past (Jan 1, 2010 to date; post GFC drawdown and aftermath; monthly granularity).
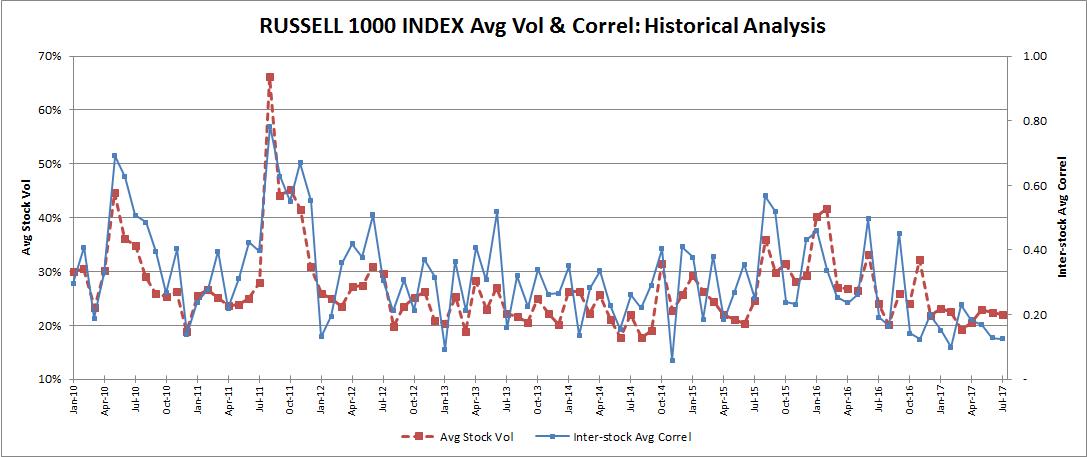
As the chart reveals, year-to-date, volatility has consistently been molasses-like. With correlation staging an ever-lower limbo, active-managers have finally outperformed. Equity L/S absolute performance has resurged with gross exposure climbing to unshackle dispersion opportunities **.
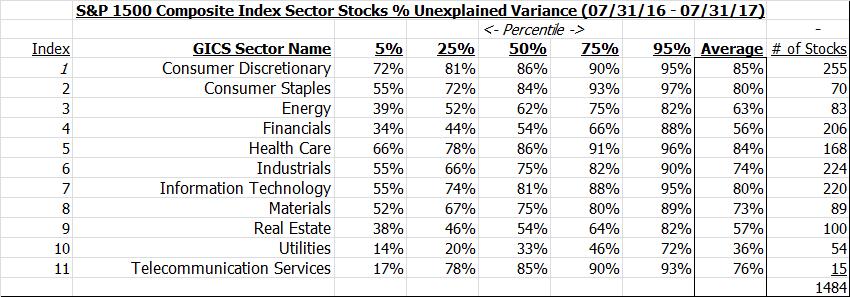
Next, a sector-level drilldown to highlight propitious alpha-propensity sectors. I used the S&P 1500 universe, partitioned stocks by their GICS sectors, and solved for the % unexplained variance (henceforth % noise), as an indicator of potential stock-selection alpha, for each stock over the past year (July 31, 2016 – July 31, 2017) ^^.
I show this below both in tabular and graphical form. The table shows the %-tile distribution of stocks % noise, and the average, arranged by their sector; the higher the % noise, the more the stock-specific variance. So, by way of an e.g., for Health Care: 75% of health care stocks have a % noise <= 91% (and 25% have a % noise > 91%) and the average health care stock has a % noise of 84%. The table and the chart, more vividly, reveal that health care, along with consumer and info tech, top the idiosyncratic noise rankings, thus potentially being more amenable to stock-specific alpha generation (L or S). I’ve ignored telecomm services in the chart given their paucity of names.

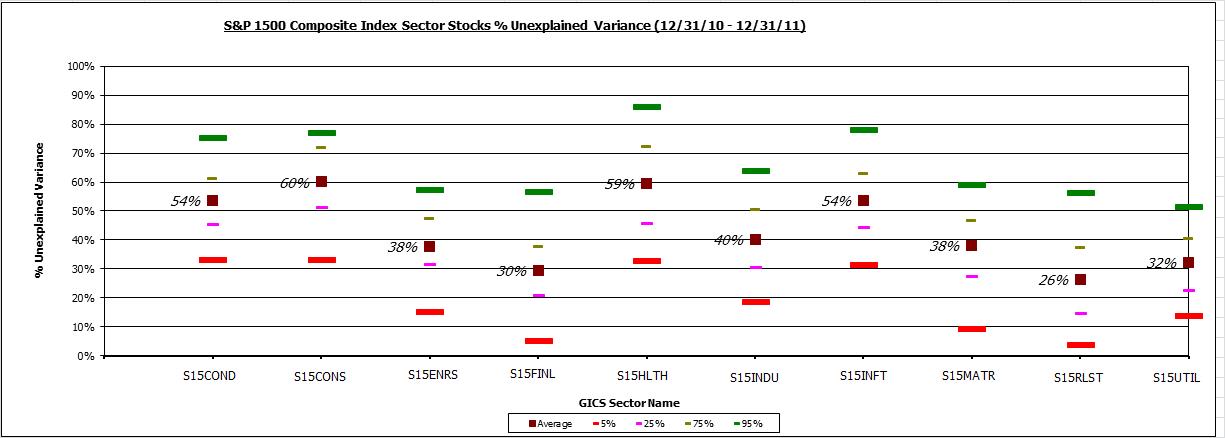
Reflecting how far stock-specific opportunity has come from the macro-driven days of 2011, I performed the same analysis for 2011, charted below, which comparatively shows the improvement in % noise between then and now, although relative sector tilts are broadly similar.
**Dispersion (formally quoted in units, like volatility, as opposed to correlation which is a bounded measure: covariance scaled by volatility), very broadly speaking, is directly related to volatility and inversely related to correlation. In fact, making simplifying assumptions, a rough rule of thumb is dispersion = avg stock vol * (1 – avg stock correl) ^ 0.5, over short horizons. Despite average correlation falling, absolute dispersion has been restrained with volatility lower. But one can theoretically harness the lower average correlation, i.e., stock-picking opportunities, by increasing the size of ones positions since volatility is lower (a L/S vehicle tends not to be constrained by the L-only fully-invested shackle); much like having a lower gross exposure in high volatility environments and vice-versa to bluntly attain a given threshold of portfolio volatility.
^^ A stocks % noise is simply that fraction of its total variance that can’t be explained by its beta wrt its sector index (for e.g., healthcare stocks beta wrt S15Hlth etc.). Effectively it represents 1 – R^2 or the unexplained residual noise after stripping away the sector-based beta influence. Additionally, by implicitly scaling by the stocks variance it puts all stocks on a level variance playing field and gets away from the issue of the lower absolute error of less volatile stocks.
Note: calculations Risk Advisors, data Bloomberg
Proprietary and confidential to Risk Advisors