
Punch line: Q3, 2017 S&P 500 sector and index returns were munificent. Sector returns were virtually unanimously positive led by secular-growth info tech. Intra-sector stock-returns were well dispersed within the consumer discretionary, healthcare, industrial and material space, while macro-driven energy, financials and real-estate, sported tighter groupings. These are reflected in the charts and tables below.
The following is an update of the quarterly sector-level dispersion analysis which reveals virtually unanimously-positive sector-level performance and varied intra-sector dispersion outcomes:
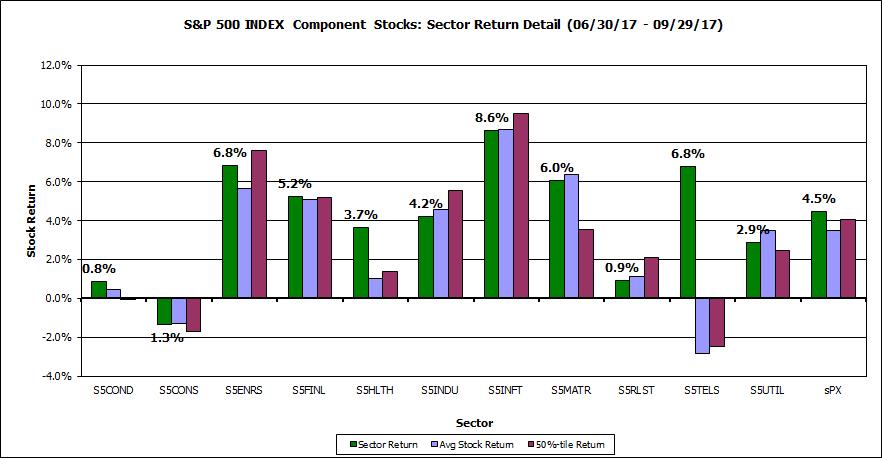
This first chart notes the sector (cap-weighted) return (green bars), average (equally-weighted) return (blue bars) and median stock return (burgundy bars) for the various sector of the S&P 500 over the Q3, 2017 horizon (with dividends, latest constituents). Sector returns, save consumer staples, were all higher led by secular-growth info tech. At the index level, though mixed at the sector-level, cap-weighted returns bested equally-weighted returns reflecting large-cap out-performance for the S&P 500 index as a whole.
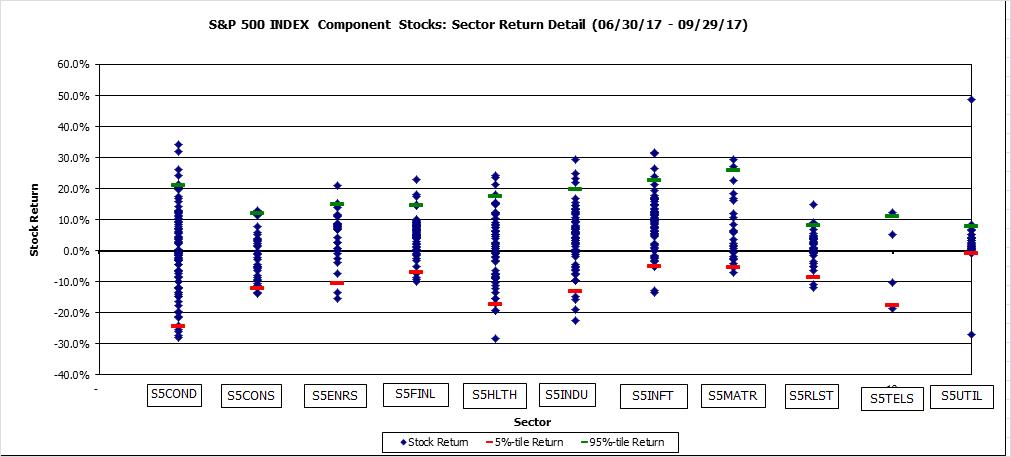
Next, a scatter plot of stock returns by sector, along with 5%- & 95%-tile markers. Intra-sector stock-returns, relative to their volatility, were well dispersed within the consumer discretionary, healthcare, industrial and material space, while macro-driven energy, financials and real-estate, sported tighter groupings. This is visually apparent in the chart below and more precisely in the table that follows.
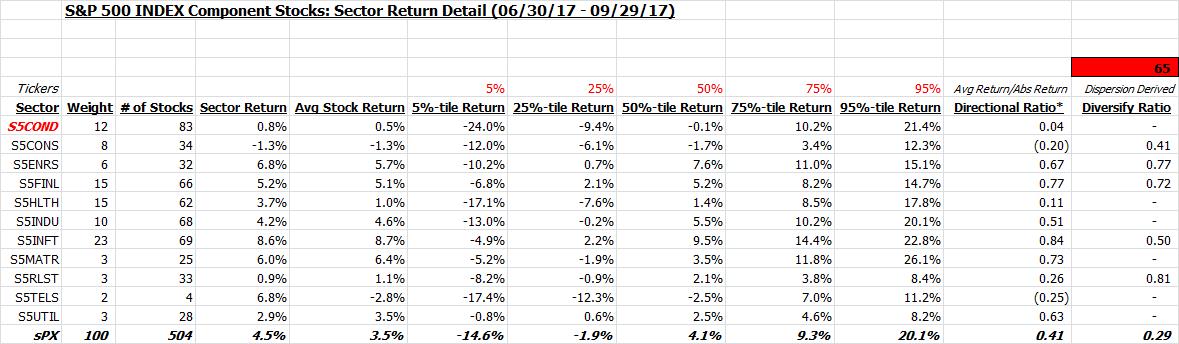
This is also shown in tabular form along with the %-tile sector return distribution. Also shown is the directional ratio (avg net return to avg gross return) and dispersion-based diversification ratio (index vol/component vol), both of which point to differential sector outcomes.
Finally, a listing of stock returns, by sector, ranked in descending order of performance is shown in the pdf link below:
Stock by sector returns Q3, 2017
And, very finally, the cumulative abnormal return (“CAR”; summation of daily beta-adjusted excess return) of the S&P 500 GICS industries, over the Q3, 2017 horizon. I ran the CAR for each S&P 500 industry, sorted them in order of out-performance, and then charted the top 10/bottom 10 CAR industries in the below pdf links.
Note: calculations Risk Advisors, data Bloomberg
Proprietary and confidential to Risk Advisors