
Punch line: with the UST 2/10 spread plumbing local lows chatter of an impending slowdown has risen. However, the gravitational pull of lower overseas yields maybe muddying the waters.
Recently, there has been a fair bit of hand-wringing at the signals telegraphed from the latest dive lower in the UST 2/10 spread, reflected in the chart below.
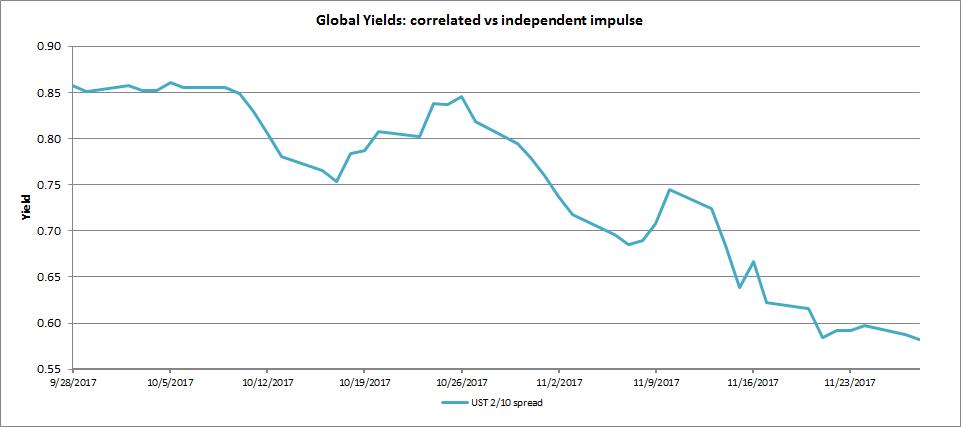
Some prognosticators believe this portends an imminent slowdown, with others going as far as to suggest an impending recession. (Generalizing, academic literature looks at the average monthly 10y to 3m UST spread inversion to potentially signal a recession 4-6 quarters out.)
This stands in stark contrast to synchronized above-trend GDP growth, employment through the structural rate, incipient wage inflation, commodities inflecting higher, supportive financial conditions, potential fiscal stimulus and the like. So what gives?
While the broad secular decline in the term premium (inflation- and real-rate risk premium) is well flagged given the global savings glut, pension-fund demand, lower macroeconomic volatility etc., the 800-pound gorilla has been the financial repression wrought by QE. While the Fed has commenced with tapering its reinvestment, the gravitational pull of lower yields continues as overseas CBs press on with their bond buying. This dynamic on long rates, coupled with higher short rates as Fed hikes are discounted, has conspired to flatten the yield curve.
The graph below traces the cumulative change in 10y yields in the US, Germany and Japan over the last 2m, which in aggregate shows the US (red) treading water, Germany (green) pulling moderately lower and Japan (blue) marginally so (given the stasis imposed by BOJ’s yield targeting).
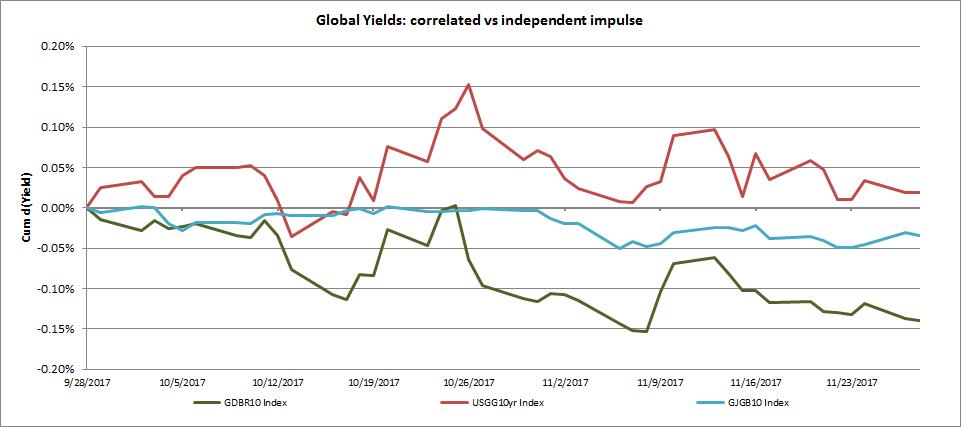
One might expect DM yields to very broadly flock together, as they directionally tend to do, and as is manifest via their positive correlation. However, delving deeper, it is instructive to note the signal telegraphed by their independent underlying economic impulse after stripping away the correlated portion of their returns. By sequentially “de-correlating” their yield-change streams **, one is able to tease out the pure independent regional impulse whose underlying signals are far more varied.
This is depicted in the graph below which presents this dynamic in volatility-scaled “z-score” units. The bold lines depict the standard realized z-scores^^ of the US (bold red), Germany (bold green) and Japan (bold blue). I then sequentially “de-correlate” the z-scores by stripping away the German impulse, followed by the US impulse. This is shown via the faint lines which depict the pure underlying independent impulse: US (faint red) has a non-trivial underlying independent impulse to higher yields once the correlated impact from lower overseas yield dynamics are stripped away from its yield, perhaps tempering the hand-wringing signal from a facile reading of the 2/10 spread.
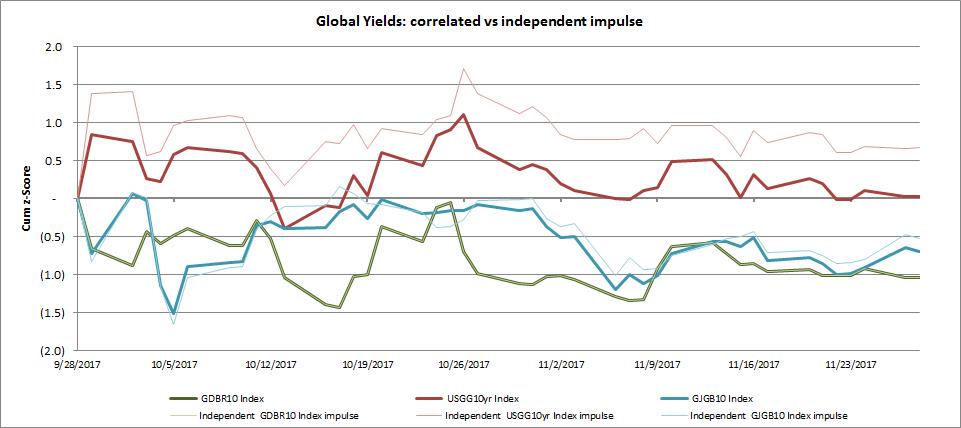
** via inverting the Cholesky decomposition lower-triangular matrix to glean uncorrelated z-scores from their correlated brethren
^^ duration-adjusted drift approximated using current carry
Note: calculations Risk Advisors, data Bloomberg
Proprietary and confidential to Risk Advisors