
Punch line: S&P 500 sector and index returns were stupendous in 2017. Sector returns were virtually unanimously positive led by secular-growth info tech. Intra-sector stock-returns were exceedingly well dispersed for most sectors; providing a fertile stock-picker canvas leading active managers to finally outperform. This is reflected in the charts and tables below.
The following is an update of the sector-level dispersion analysis which reveals virtually unanimously-positive sector-level performance and well-dispersed intra-sector stock returns:
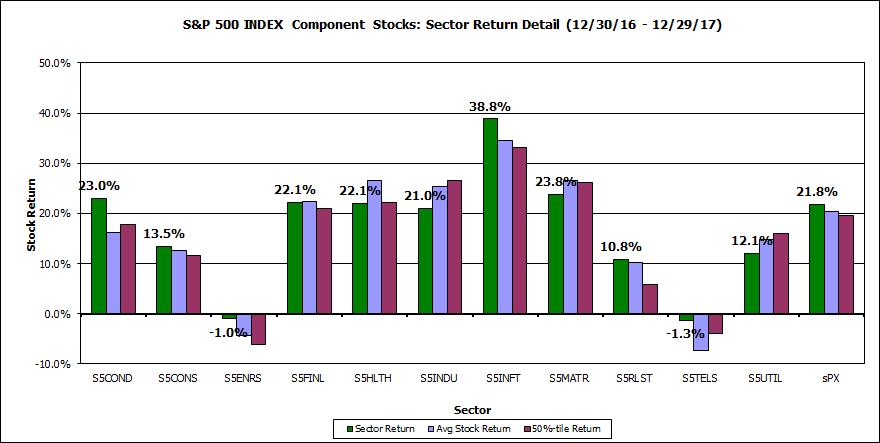
This first chart notes the sector (cap-weighted) return (green bars), average (equally-weighted) return (blue bars) and median stock return (burgundy bars) for the various sector of the S&P 500 over the calendar 2017 horizon (with dividends, latest constituents). Sector returns, save energy and telecom services, catapulted higher led by secular-growth info tech. At the index level, though mixed at the sector-level, cap-weighted returns bested equally-weighted returns reflecting large-cap outperformance for the S&P 500 index as a whole.
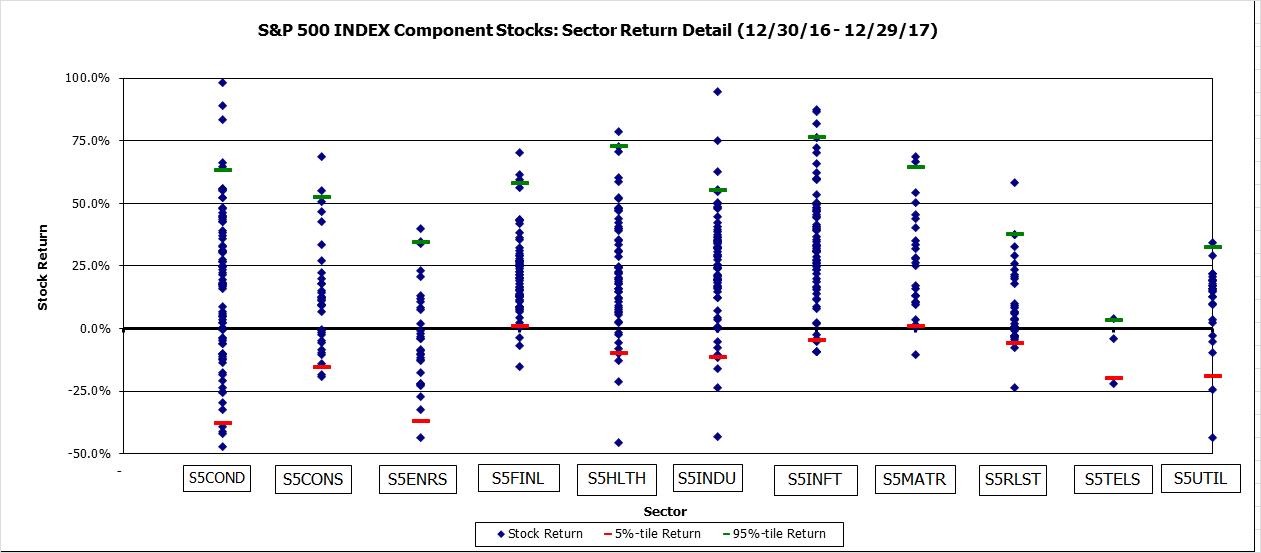
Next, a scatter plot of stock returns by sector (save a few scale-perverting outliers), along with 5%- & 95%-tile markers. Intra-sector stock-returns, relative to their volatility, were exceedingly well dispersed, save the trio-stock telecom-services sector, with energy, financials and real-estate perhaps reflecting a faint tinge of correlated macro influence. This is visually apparent in the chart below and more precisely in the table that follows.
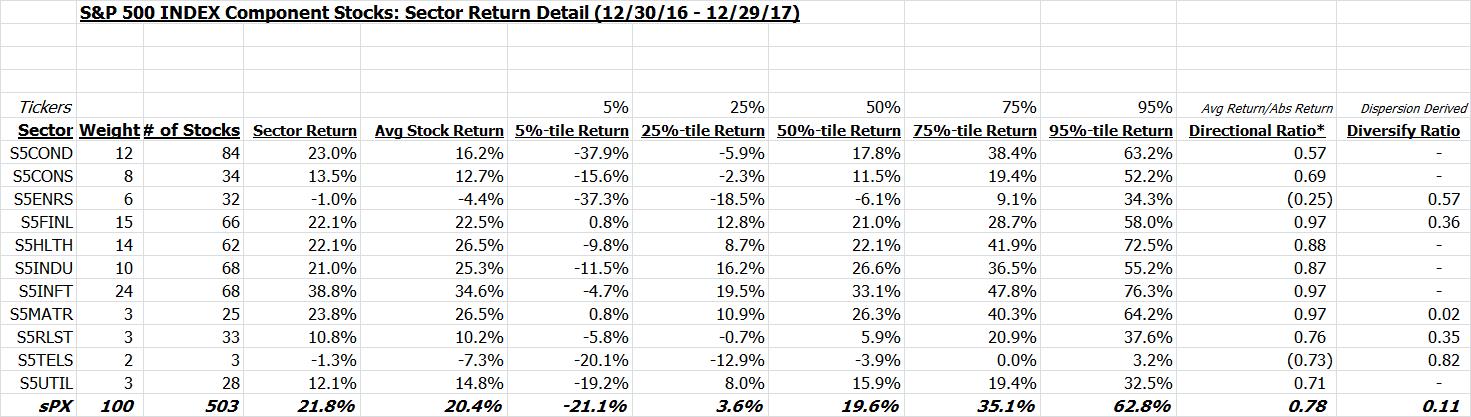
This is also shown in tabular form along with the %-tile sector return distribution. Also shown is the directional ratio (avg net return to avg gross return) and dispersion-based diversification ratio (~ index vol/component vol), both of which point to well dispersed sector outcomes.
Finally, a listing of stock returns, by sector, ranked in descending order of performance is shown in the pdf link below:
And, very finally, the cumulative abnormal return (“CAR”; summation of daily beta-adjusted excess return) of the 24 S&P 500 GICS industry-groups, over the 2017 horizon. I ran the CAR for each S&P 500 industry-group, sorted them in order of outperformance, and charted the top 12/bottom 12 CAR industry-groups in the below pdf links. Shown alongside the charts is the recent CAR trend to transmit second-order CAR behavior and, at the risk of transmitting false signals, a qualitative signaling label based on the recent ST CAR trend (using a rules-based algorithm to quantify the qualitative labeling process).
Note: calculations Risk Advisors, data Bloomberg
Proprietary and confidential to Risk Advisors