
Punch line: risk premiums across most macro asset-classes tend to expand synchronously at times of market angst. However, the interest-rate term premium has heretofore tended to provide a risk-mitigation benefit.
Dovetailing on the recent, Unsophisticated term premium “uTP” post, which presented a common-sense, practitioner’s estimate of the term premium for embracing duration risk, the following pictorial analysis studies the risk-premium relationship between a variety of macro asset-classes over the mid-term past (Jan 1, 2010 to date; post GFC drawdown and aftermath).
The following macro asset-class risk-premium gauges (non-overlapping weekly average) were used:
- Equity: VIX
- Credit: IG CDS
- Currency: JPY 6m .25d risk reversal (OTM, Yen call – put)
- Commodity: Gold 6m .25d risk reversal (OTM, Gold call – put)
- Rates: 10y term premium (aforementioned uTP)
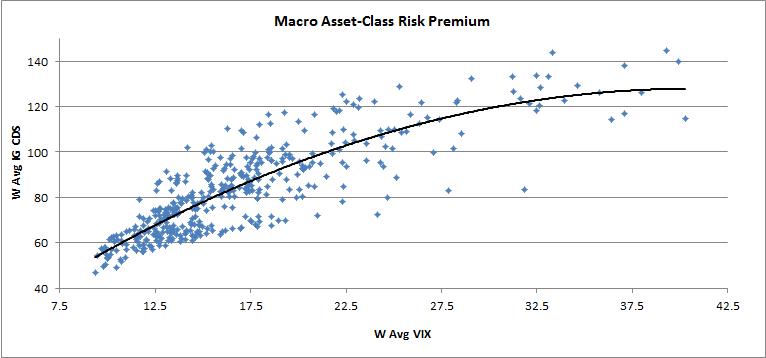
Since the VIX, for better or for worse, tends to serve as the go-to market risk barometer, the following scatter-charts plot the risk-premium relationship of different macro asset-classes vs. the VIX.
Credit: as one would expect, a fairly robust relationship between credit spreads and the VIX as credit spreads represent the risk-premium compensation for assuming default risk and, by virtue of being an OTM short put on the value of a firm’s assets, are directly impacted by volatility.
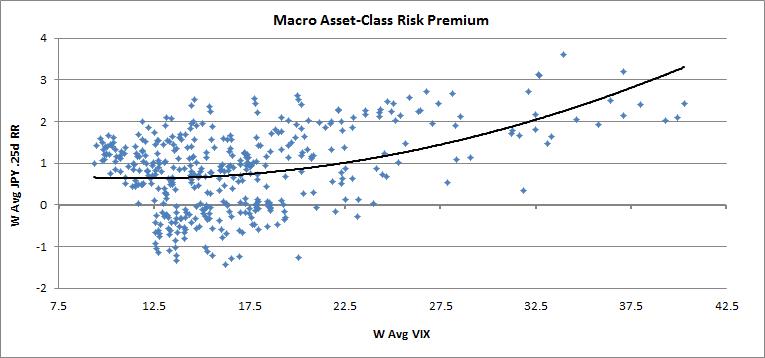
Currency: quite random at low-to-mid levels of the VIX, but higher VIX levels tend to be associated with a risk-off, flight-to-quality environment causing the yen skew to outperform in tandem.
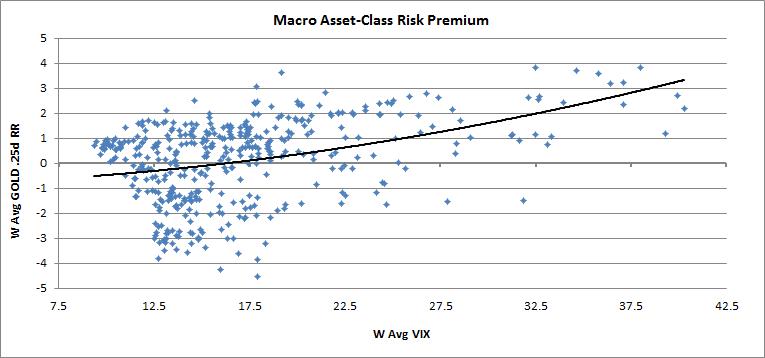
Commodity: like the prior graph, quite random at low-to-mid levels of the VIX, but higher VIX levels tend to be associated with a risk-off environment causing the gold skew to concurrently outperform.
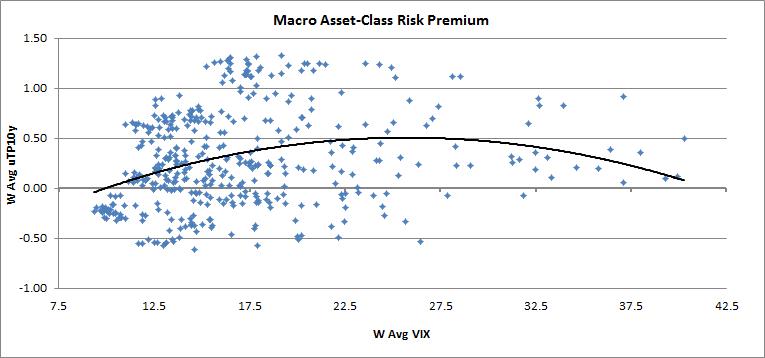
Rates: overall an uncorrelated risk-premium relationship between rates and the VIX, thereby adding to the diversification allure of risk-parity strategies (more on this below). Very low VIX levels, like the current environment, have seen all stirpes of risk embraced, including lower term-premium risk. And very high VIX levels, generally symptomatic of flight-to-safety, have hitherto also been associated with depressed term premiums, contributing to the “frown” curve, tremendous noise notwithstanding.
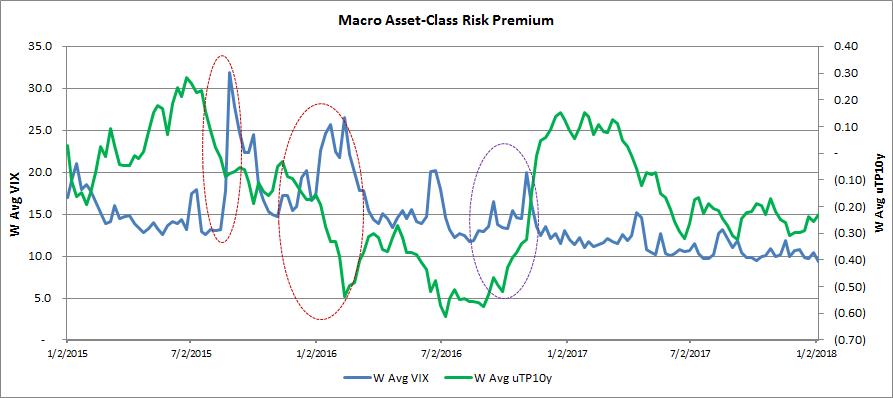
As alluded to above, on the risk-mitigation front, risk-parity strategies have heretofore largely been the beneficiary of term-premium compression in the face of equity risk-premium expansion. This is illustrated in the recent time-series chart below (VIX: blue/left y-axis; term premium: green/right y-axis) with the two red-circled episodes (summer-2015 CNY wobble and winter-2015 oil trouble) stylizing this dynamic. However, as the purple-circled episode (winter-2016 risk-parity scare) highlights, inflation risk can rapidly upend this favorable hedge dynamic causing both risk premiums to inflate simultaneously.
Finally, by way of reference, Macro asset-class correlation regime evolution, presents a qualitative hypothesis of macro regime evolution.
Note: calculations Risk Advisors, data Bloomberg
Proprietary and confidential to Risk Advisors