
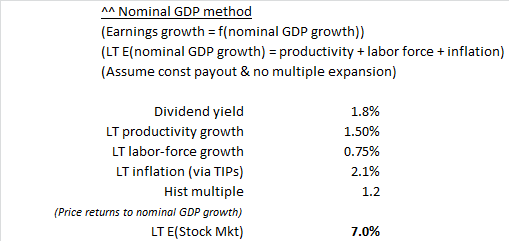
Punch line: the current local rally is very long in the tooth; both time elapsed since a 5% pullback (longest) as well as magnitude of the local rally (greatest), per the splicing detailed below. Tempering euphoria with caution, per historical precedent, a market return of 7.0% is consistent with an average intra-annum E(drawdown) estimate of -10.5% (-8.6% median).
Latest wobbles notwithstanding, given the stratospheric ascent of the S&P 500 (“SPX”), coupled with molasses-like volatility and record calendar length devoid of significant pullbacks, the following analysis attempts to temper euphoria with caution by marrying return expectation with drawdown potential.
To set the stage, the following chart traces the historical drawdown (Jan 1, 1987 to date; weekly returns) experienced by the SPX, relative to its trailing high-water mark.
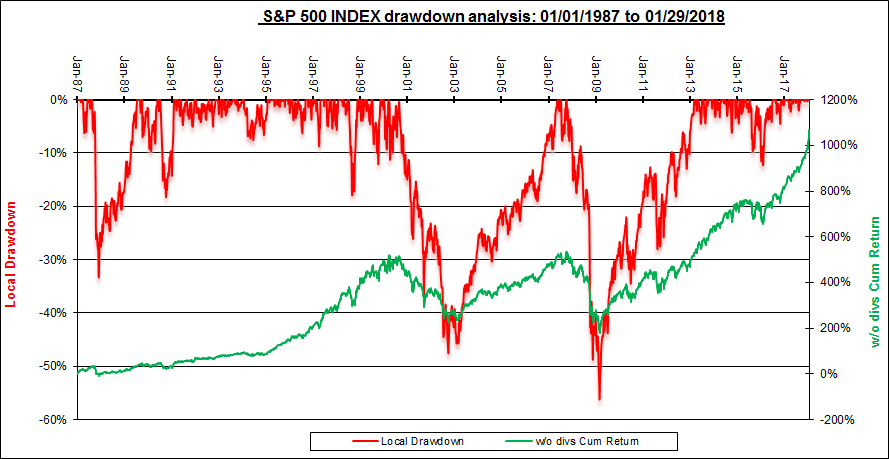
As is visually apparent, the SPX has tended to hibernate for protracted periods in extreme drawdown slumps before re-scaling its trailing high-water level. By splitting elongated drawdown episodes into several punctuated intra-drawdown episodes, via resetting the trailing high-water mark lower post a bear-market rally, we are able to harvest more, and more frequent, drawdown episodes.
Similarly, by resetting the trailing low-water mark higher post a bull-market selloff, we are able to tease out multiple local rally episodes from a largely ascendant SPX. The reset trigger used was 20% for a bear-market rally, which tends to be multiples more severe, than the 5% used for a bull-market selloff. These machinations are reflected in the chart below:
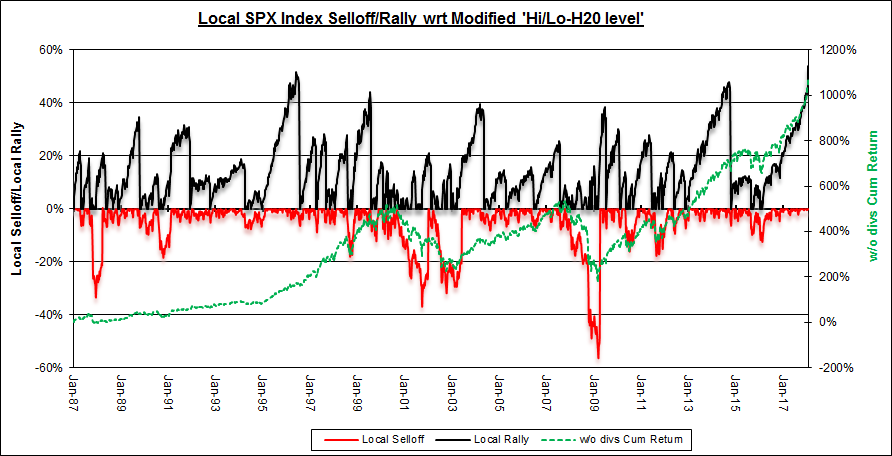
As the chart attests, per this splicing, the current local rally is very long in the tooth; both time elapsed since a 5% pullback (longest) as well as magnitude of the local rally (greatest).
Drawdown potential:
Volatility, which begets drawdown, is hypothesized, and largely empirically verified, to broadly be inversely proportional to market returns: lower volatility, hence shallower drawdowns, in up market and higher volatility, hence deeper drawdowns, in down markets. Additionally, expected market return forecasts are a lot more pervasive, and easier to prognosticate upon, than expected volatility or drawdown estimates.
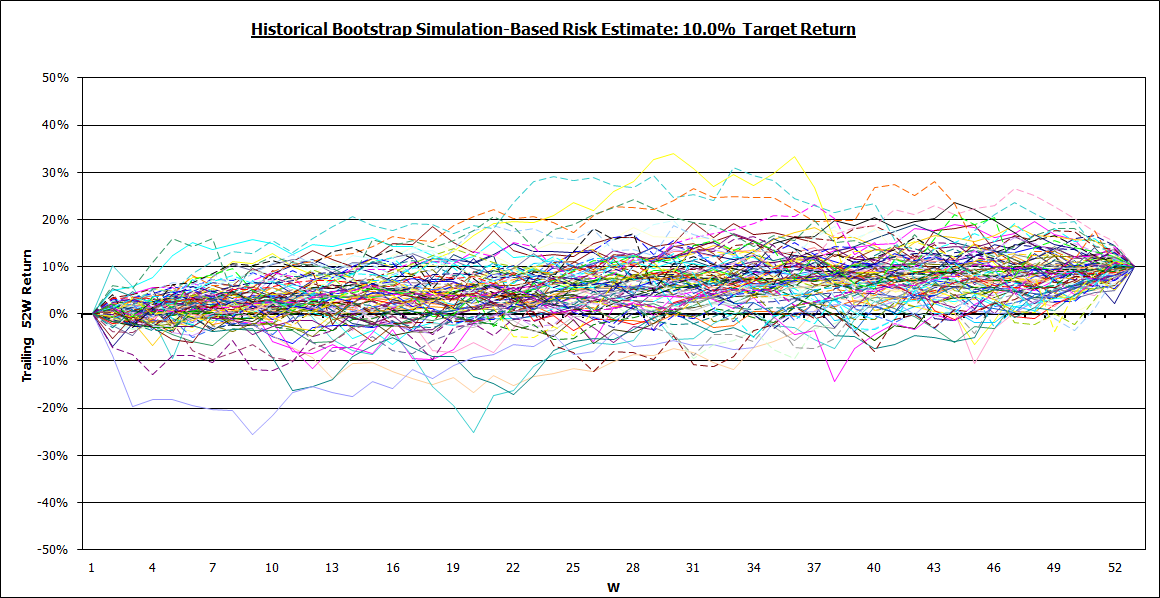
I’ve attempted to marry drawdown potential with expected returns, using a historical bootstrap simulation-based approach**, to try and answer the following question: what intra-annum drawdown threshold is commensurate with an annual market return forecast of xx%?
The chart below displays the results of these algebraic gymnastics:
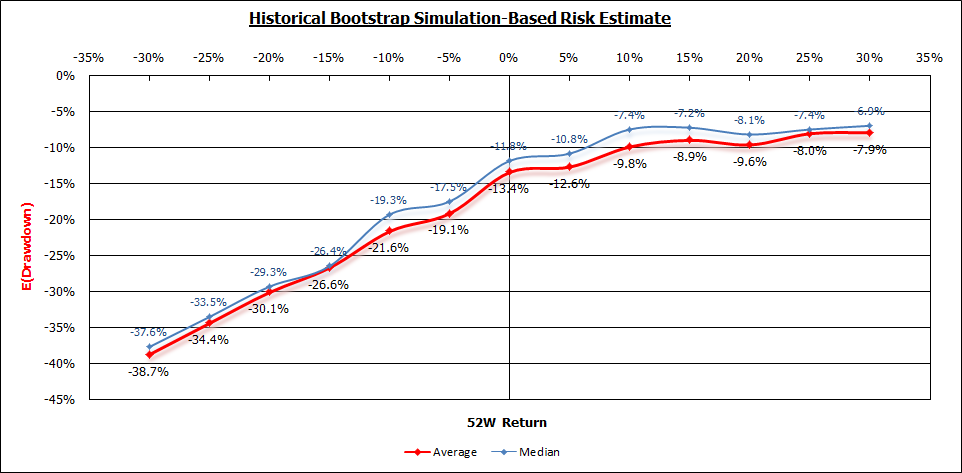
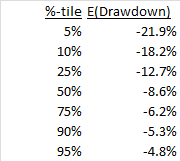
Getting more granular, assuming an SPX E(return) of 7.0% (nominal GDP E(growth) based^^), would yield an average intra-annum E(drawdown) estimate of -10.5% (-8.6% median) with the following range of potential outcomes:
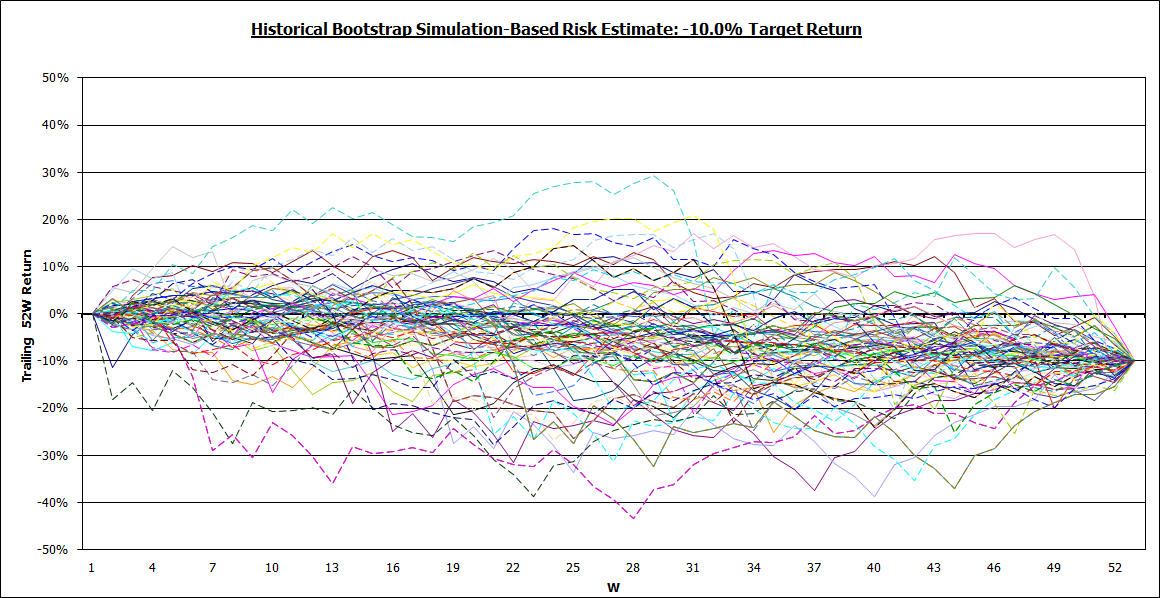
** In order to arrive at the E(drawdown) estimate I used historical trailing 1y returns (Jan 1, 1987 to date; weekly returns; overlapping data periods) as the base data. I then selected 100 random draws each, centered around the target market return forecast, to generate 100 annual paths of weekly returns (drift-adjusted to match the target return), averaged the worst drawdown along each of the 100 paths, in order to arrive at the E(drawdown) estimate.
As one would expect, simulations centered around –ve market return forecasts yield more dispersed outcomes and hence are more vulnerable to larger drawdowns. This is visually evident in the charts below for +10% and -10% return forecasts, respectively.
Note: calculations Risk Advisors, data Bloomberg
Proprietary and confidential to Risk Advisors