
Punch line: extreme episodes of UST 10y rates rising with the MSCI EM concurrently selling off, a potential risk scenario, has EM consumer staples and EM healthcare as relatively consistent out-performers; recently, post the early 2000 “nesting” phase, EM real estate has been a notable under-performer.
Given the upending of the halcyon low-vol days of 2017, and the accompanying rising-rate environment and strident rhetoric surrounding trade protectionism, I attempted to parse history, admittedly awkwardly, for a potential risk milieu. Specifically, UST 10y rate selloff episodes accompanied by EM equity drawdowns.
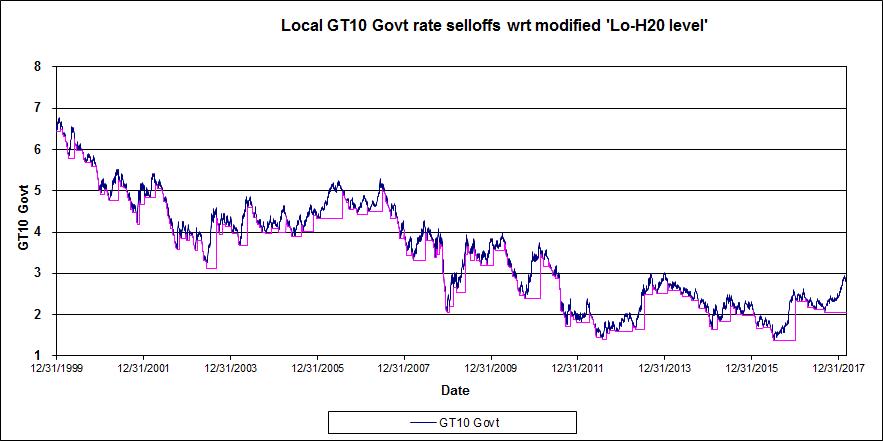
To color the rising rate canvas, I harvested significant UST 10y rate selloff episodes, subject to a modified low-water mark, from the chart below (1/1/2000 to date):
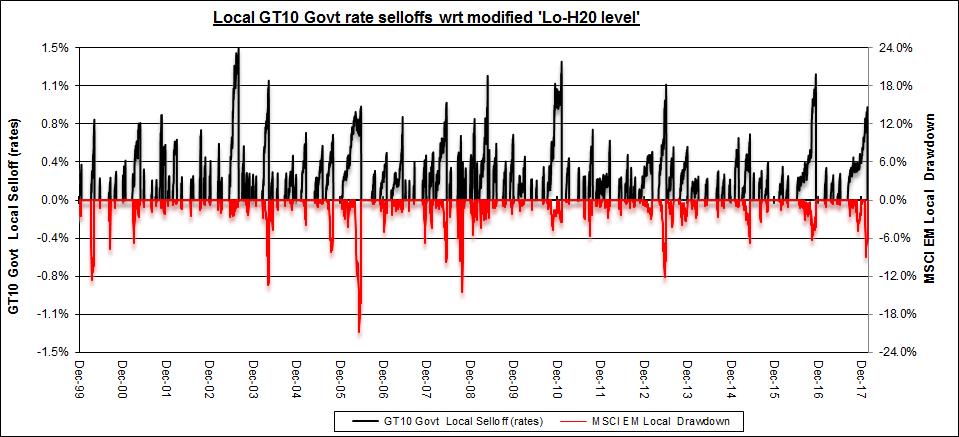
Since not all UST 10y rate selloffs show MSCI EM losses (e.g., risk-on) and more often than not the max MSCI EM drawdown does not occur concurrently with the local UST 10y rate selloff episode, I combed through each rate selloff episodes to tease out the max intra-episode MSCI EM drawdown (scenario-generation mechanics described below**). This is visually depicted in the following chart (left y-axis: rate selloffs in black; right y-axis: MSCI EM drawdown in red):
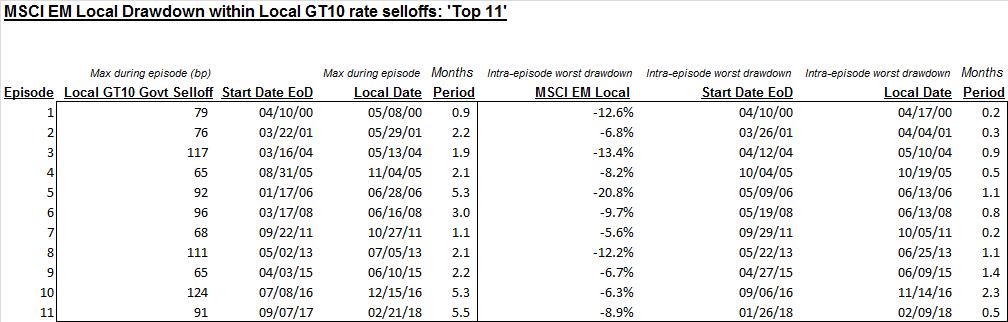
Further, I only selected extreme rate-contingent episodes where the MSCI EM returned <= -5% and UST 10y rate sold off >= 50bps (blacking out 9/1/08-3/31/09 eye of the GFC storm); this yielded 11 extreme joint episodes, shown below:
Finally, the below pdf enumerates MSCI EM drawdown, and sector response, within extreme UST10y rate selloff episodes. Shown are the MSCI EM sector statistics, ranked best to worst, for each episode. As the scenarios are quite disparate, it may be more meaningful to focus on environmentally-pertinent episodes.
**To illustrate the episode-generation process consider the following e.g.: local UST10 rate selloff episode (09/07/17 – 02/21/18): 91bps; max intra-episode MSCI EM drawdown (01/26/18 – 02/09/18): -8.9%. Since MSCI EM <= -5% and UST10y rate selloff >= 50bps, this represents a joint extreme-episode scenario.
Note: calculations Risk Advisors, data Bloomberg
Proprietary and confidential to Risk Advisors