
Punch line: overall average correlation over large swathes of time and/or market environments masks significant correlation variability, which is dependent on the underlying market habitat; macro straitjacket in turbulent markets and stock-specific diffusion in more sanguine environs.
Risk, return and correlation represent faces of the market prism that refract off each other to determine investment outcomes. The following expose highlights their intertwined relationship over the recent past (Jan 1, 2010 to date; post GFC draw-down and aftermath).
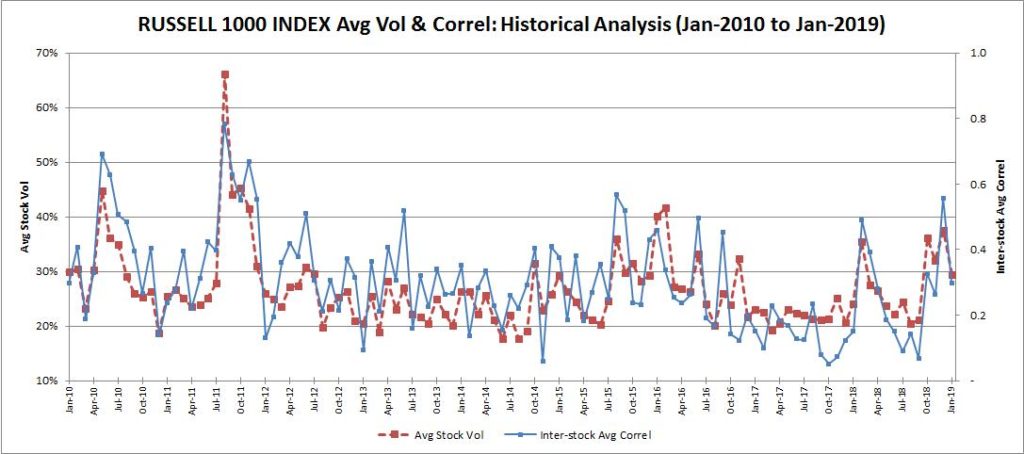
The time-series chart below traces the average stock volatility (red; left y-axis) and inter-stock correlation (blue; right y-axis) of the Russell 1000 stocks, on a monthly basis. As is visually apparent, average stock volatility and correlation tend to rise and fall commensurately; markedly so at the extremes.
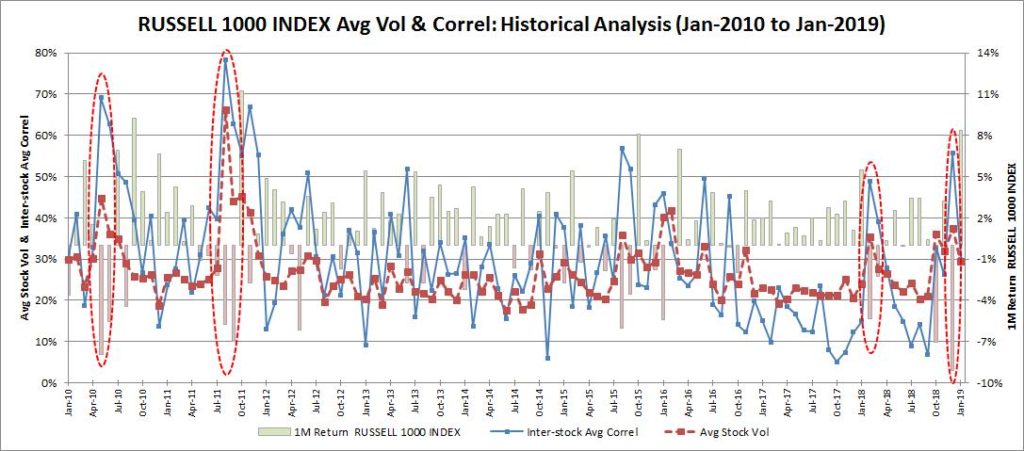
The next chart adds monthly Russell 1000 index returns (green/red bars; right y-axis) to the previous volatility and correlation time series (both left y-axis) which, despite its busyness, depicts that particularly during severe market draw-downs (for e.g., spring 2010, summer 2011, early & late 2018 highlighted, and to name a few) volatility and correlation concomitantly surge higher. Additionally, better manifest in the scatter-plots and table that follow later, strongly +ve market returns elicit an upward smirk in volatility and correlation.
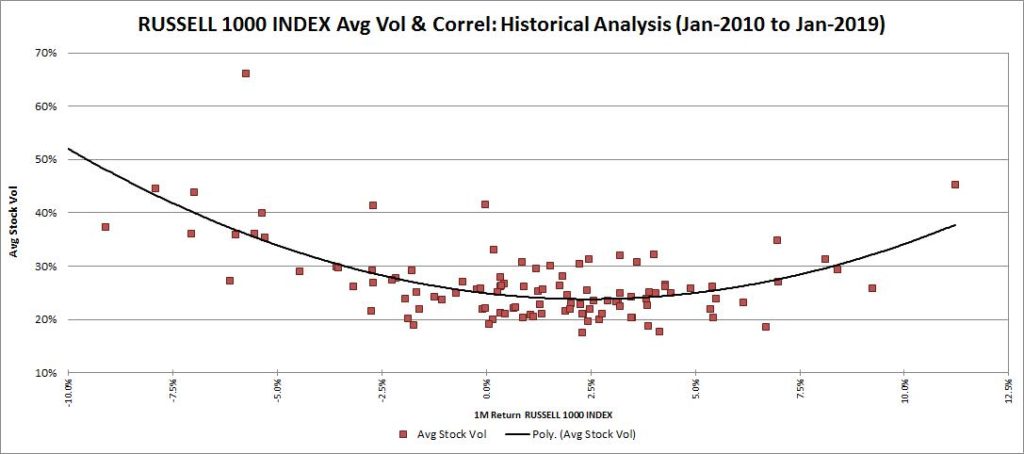
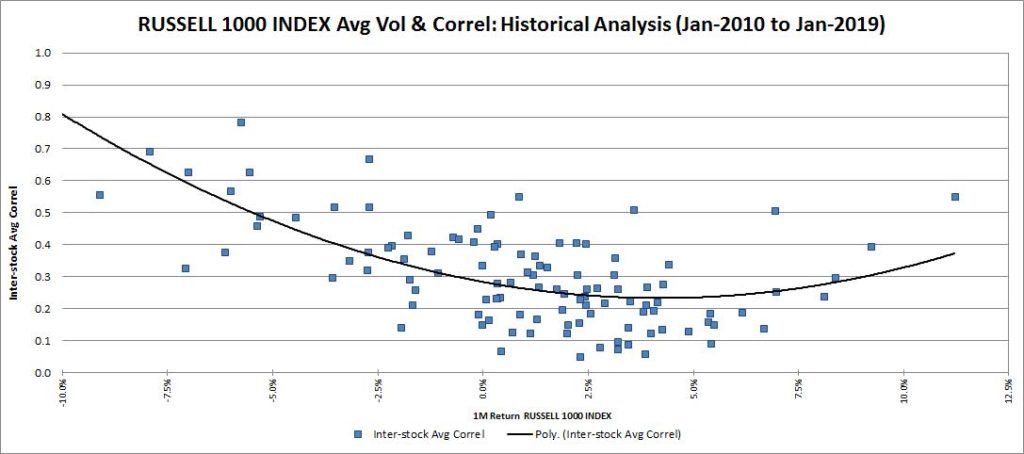
The next three cross-sectional scatter-plots, volatility and correlation vs. returns, further reflect this inverse relationship, upward smirk notwithstanding, between returns and risk metrics: volatility and correlation.
Average stock volatility:
Average inter-stock correlation:
And, their co-dependent, index volatility:
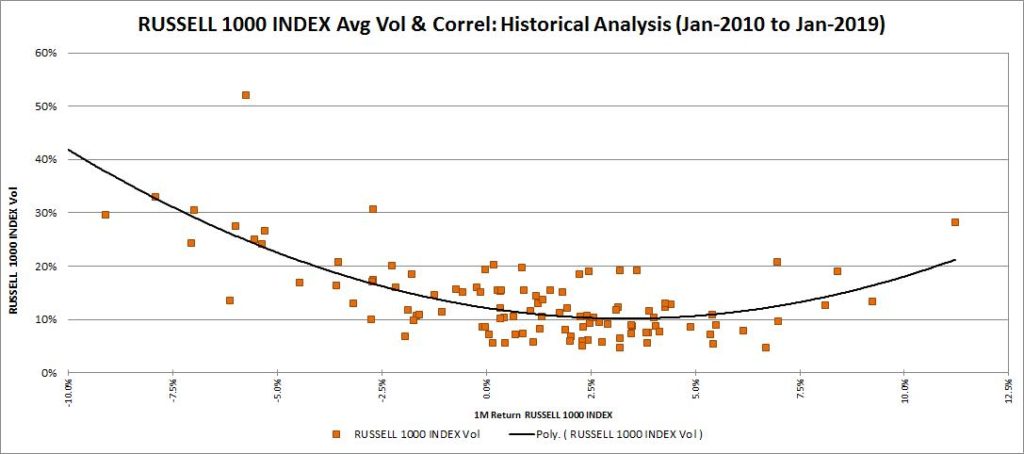
The table below summarizes the above relationships by segmenting monthly index returns into five buckets: strongly +/-, moderately +/- and normal range. Shown alongside is frequency of occurrence and conditional averages: index return, stock volatility, inter-stock correlation and index volatility, contingent on index-return thresholds, which further cements the largely inverse risk-return relationship into usable rules-of-thumb.
Dynamic vs. static correlation:
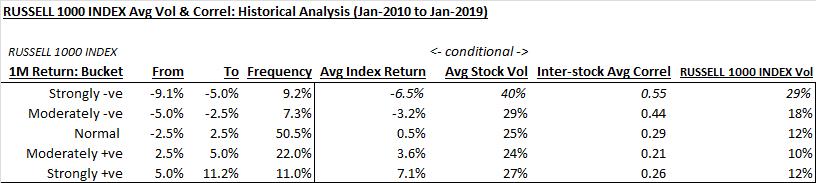
As the above analysis reveals, overall average correlation over large swathes of time and/or market environments masks tremendous correlation variability, which is dependent on the underlying market habitat; macro straitjacket in turbulent markets and stock-specific diffusion in more sanguine environs. This dynamic vs. static correlation behavior is illustrated via the scatter-plots below.
The first chart displays the static correlation relationship between two stocks (quoted as z-values) where the slope of the trend line reflects the correlation between them (average correlation over entire data horizon) and the dispersion around the trend-line reflects idiosyncratic, stock-specific risk. Note the largely equivalent dispersion across the entire range of sample values.
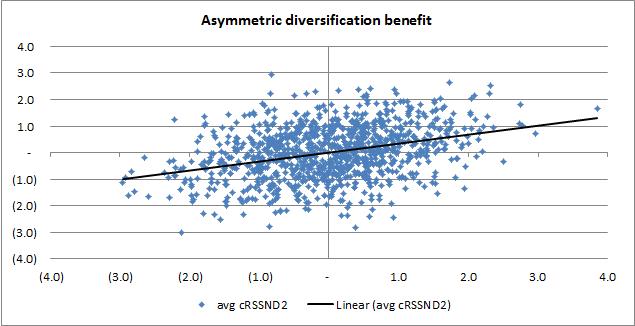
The next chart uses a dynamic correlation profile, proximately gleaned via the above data, with the changing slope of the trend-line highlighting the variable correlation dynamic: lower correlation and hence greater stock-specific opportunity in sanguine markets; higher correlation and hence lower stock-specific element (more closely hugging the trend line) in down markets (firming in strongly +ve markets too).
Finally, a few observations:
- during sanguine market environments, characterized by moderate/quiescent volatility and correlation, stocks tend to march to the beat of their own idiosyncratic drummer providing a fertile stock-picking environment
- on the other side of the coin, noxiously volatile environments see risk-premiums expand, correlation tend to boundary conditions as birds of a risk feather flock together tarred by a common macro-factor brush, diversification benefit dissipate, and stock-to-bond flight-to-quality, including safe-haven sector rotation, ensue
- portfolio volatility is vulnerable to rapid, adverse escalation in fragile markets as both fast-rising average stock volatility and inter-stock correlation conspire to upend portfolio risk metrics, and diversification benefit, relative to more languid times
- related, historical-based volatility/VaR frameworks often work wonderfully well in normal situations but tend to fail in extreme environments, precisely when they matter most, as their building blocks (volatility, correlation) tend to be muted post placid episodes thereby potentially setting themselves up for failure in the event of market shocks
- relationship between volatility, correlation and dispersion: dispersion (formally quoted in units, like volatility, as opposed to correlation which is a bounded measure: covariance scaled by volatility), very broadly speaking, is directly related to volatility and inversely related to correlation. In fact, making simplifying assumptions, a rough rule of thumb is dispersion = avg stock vol * (1 – avg stock correl) ^ 0.5, over short horizons. In sanguine markets with average correlation falling, absolute dispersion can remain restrained with volatility falling even lower. But one can theoretically harness the lower average correlation, i.e., stock-picking opportunities, by increasing position size since volatility is lower (L/S vehicles tend not to be constrained by the L-only fully-invested shackle); much like having a lower gross exposure in high volatility environments, and vice-versa, to bluntly attain a given threshold of portfolio volatility.
Note: calculations Risk Advisors, data Bloomberg
Proprietary and confidential to Risk Advisors