Punch line: frenetic trend-following market-timing incurs a whipsaw cost from buying high/selling low, akin to the theta cost of option creation. In contrast a more temperate approach of opportunistically, and judiciously, re-calibrating exposure, based on the prevailing macro environment and resultant price action, may represent an effective balance between the two extremes of indolence and hyperactivity.
Market-timing is alluringly seductive: buy when the market’s going up, sell when it’s going down. In practice, it’s often worse than a coin flip given volatility and slippage.
The following expose illustrates a hypothetical trend-following market-timing strategy wittingly, or unwittingly, followed by a vast preponderance of equity L/S PMs: increase net exposure on up days, reduce net exposure on down days. This is stylistically illustrated in the chart below: **
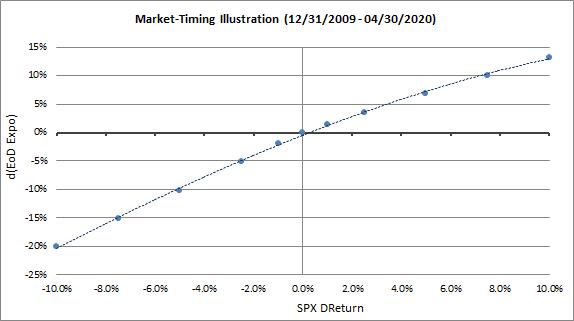
Net exposure (floored at 0%, capped at 70%) was set at 35% at the beginning of each month and varied daily per the above heuristic based on market performance. Monthly market returns of three flavors of net exposure were computed:
- dynamic net (changing daily based on above heuristic)
- constant net: 35%
- constant net: monthly average of dynamic net ***
Market-timing (dynamic net – constant net) return statistics, for the period Jan 1, 2010 to April 30, 2020 on a monthly basis, were as follows:
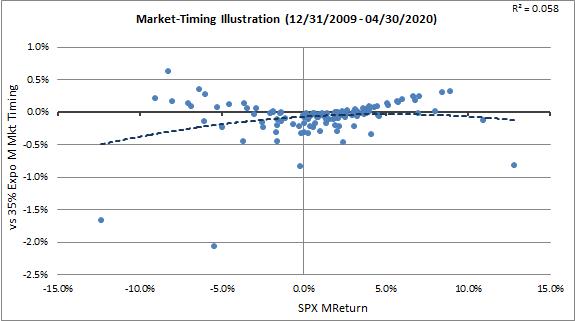
- market-timing return vs. constant 35% net averaged -8bps per month (-90bps annually) and was +ve 32% of the time
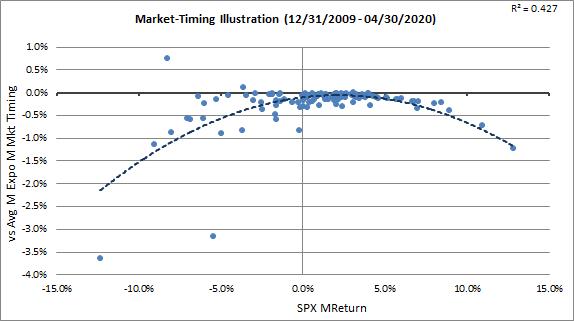
- market-timing return vs. constant monthly average net averaged -22bps per month (-270bps annually) and was +ve 2% of the time
This is illustrated in the charts below, graphed against the S&P 500 monthly return on the x-axis:
vs. constant 35% net exposure:
vs. constant monthly average net exposure:
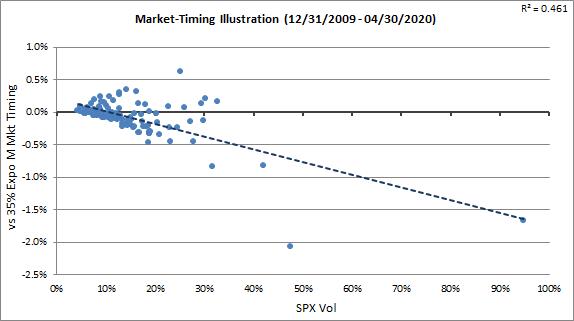
Further, as might be expected, market-timing return was inversely correlated with volatility as reflected in the charts below:
vs. constant 35% net exposure:
vs. constant monthly average net exposure:
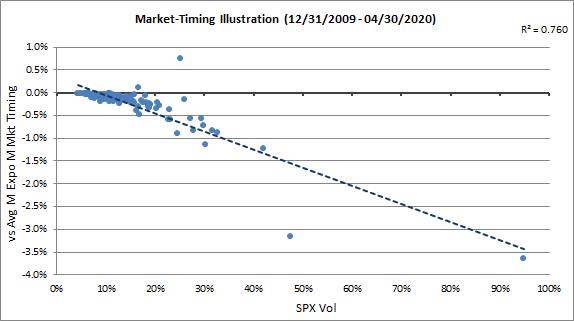
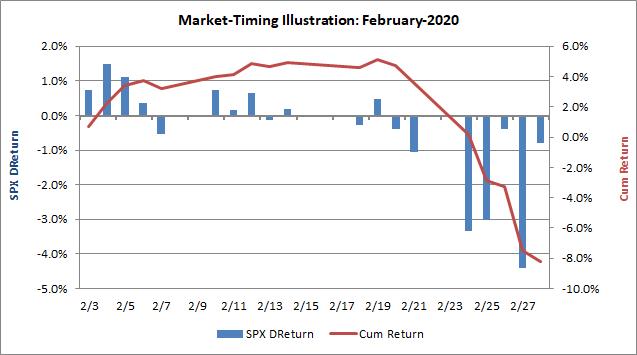
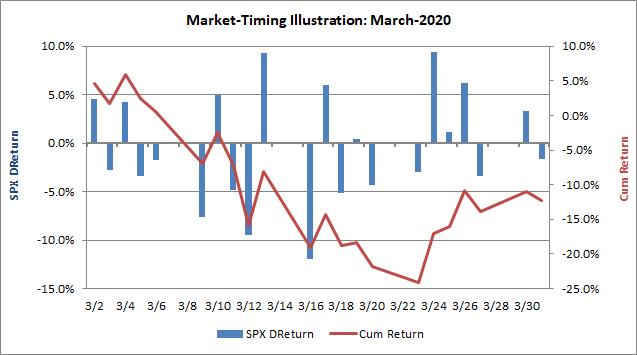
Next, I looked at the best/worst months for market-timing over this data horizon. As one might hypothesize, market-timing performs best in strongly trending markets and worst in schizophrenic, whippy markets. This is confirmed by looking at the AR1 correlation between daily returns and prior day returns. For instance, Feb-2020 was the best month for market-timing, with a string of +ve returns in the first half of the month followed by a string of –ve returns in the second half of the month, resulting in an AR1 correlation of 0.44. Conversely, March-2020 was the worst month for market-timing with returns see-sawing through the month, resulting in an AR1 correlation of -0.54. This behavior is further illustrated in the following charts (left y-axis: S&P 500 daily returns, blue bars; right y-axis: S&P 500 cumulative returns, brown line):
Feb 2020: favorable trending market-timing environment:
March 2020: adverse whippy market-timing environment:
In conclusion, frenetic trend-following market-timing incurs a whipsaw cost from buying high/selling low, akin to the theta cost of option creation. In contrast a more temperate approach of opportunistically, and judiciously, re-calibrating exposure, based on the prevailing macro environment and resultant price action, may represent an effective balance between the two extremes of indolence and hyperactivity.
** exposure variation was approximated using the change in delta of a hypothetical call option, with onerous downside vs. upside gamma reflecting risk aversion, to effect larger/smaller curtailing/enhancing of net on down/up days.
*** monthly average net is not known ex-ante but effectively represents the average accumulation of dynamic exposure response to the market as information unfolds. While setting a high bar this is effectively the hurdle employed by investors to evaluate the passive market contribution to returns for the month, with market-timing skill representing the difference from actual market contribution to returns.
Note: calculations Risk Advisors, data Bloomberg
Proprietary and confidential to Risk Advisors
