Punch line: using a simulation-based framework to evaluate retirement outcomes, and assuming an initial wealth of 32x real annual spend, projects a 1 in 8 chance of wealth wipeout in year 35; by year 40 that escalates to 1 in 4.
The road to retirement is paved with much angst and many analyses, both rudimentary and complex, to gauge the amount of savings required to secure an appropriate retirement lifestyle. To add to the detritus, Risk Advisors has developed a simulation-based framework to help evaluate the retirement conundrum.
To set the stage, consider the following illustrative input parameters:
- initial wealth (at start of retirement): $4,000,000
- initial annual spend (subsequently inflation-adjusted): $125,000
- expected portfolio return: 5.0%
- portfolio volatility: 7%
- expected Inflation: 2.5%
- inflation volatility: 1.25%
- portfolio-Inflation correlation: -0.25
Note: expected portfolio return assumes a modest premium to equilibrium nominal GDP growth, which in turn is a function of population growth, productivity and inflation; portfolio volatility pays homage to prior research on macro asset-class-based mean-variance portfolios; expected inflation is loosely based on LT inflation markets; inflation volatility is contrived to arrive at a not unrealistic +/- 2-sigma range; as is portfolio-inflation correlation reflecting inflationary regimes tend to be inauspicious for portfolio returns.
Next, I constructed two matrices of 1,000 random paths each, 50 annum per path, one for portfolio returns and the other, appropriately correlated, for inflation. Superimposing the above assumptions on the path structures yield the following conclusions:
Nominal (unadjusted for inflation) annual spend:
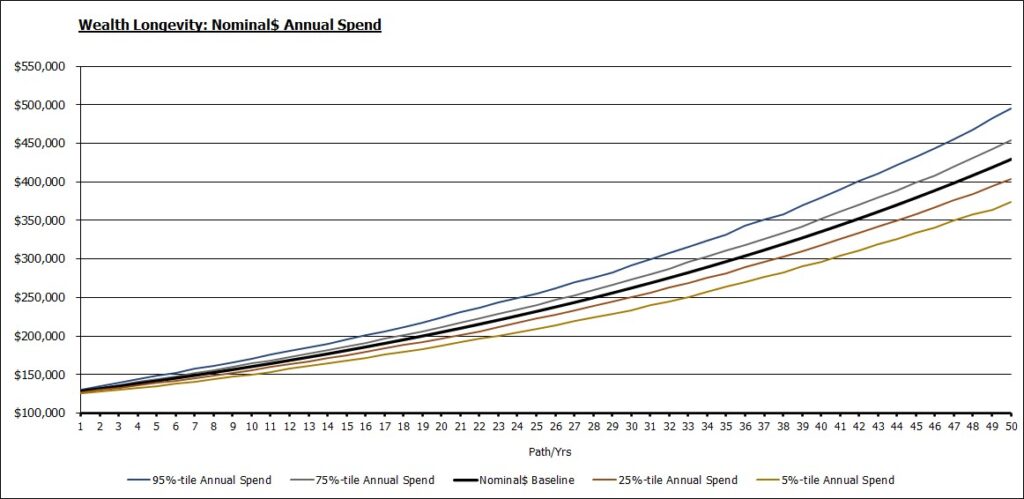
The middle black line traces the baseline nominal annual spend using expected inflation of 2.5%. It is fanned by upper and lower percentile nominal annual spend values reflecting inflation variability.
Nominal (unadjusted for inflation) annual wealth:
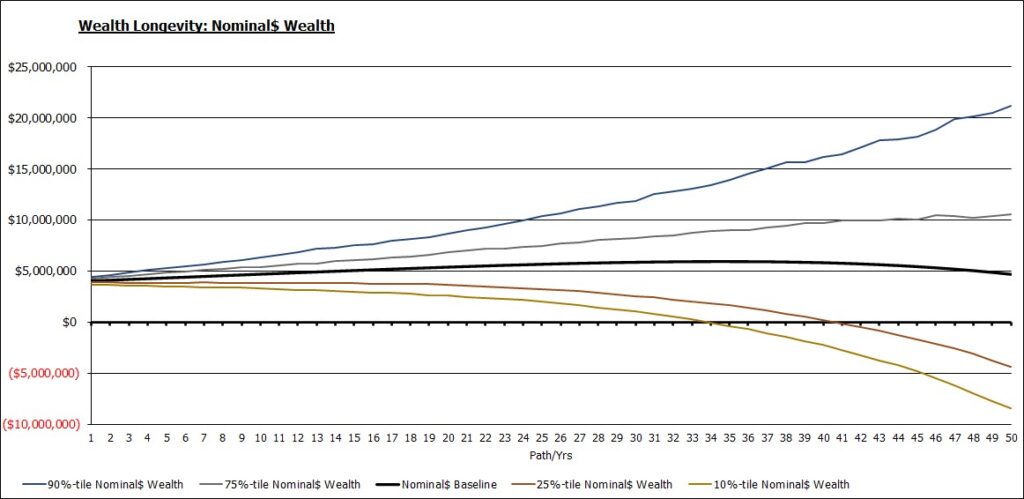
The middle black line traces the baseline nominal annual wealth using expected portfolio return of 5.0% and deducting for baseline nominal annual spend. It is fanned by upper and lower percentile nominal annual wealth projections reflecting portfolio volatility on nominal wealth generation and inflation variability on nominal annual spend. The ravages of inflation wreak havoc on purchasing power which the next chart adjusts for. Note: negative outcomes illustrate theoretical wealth shortfall; in practice it’s a harbinger to beg, borrow, steal (more prudently, proactively restructure)!
Real (inflation-adjusted) annual wealth:
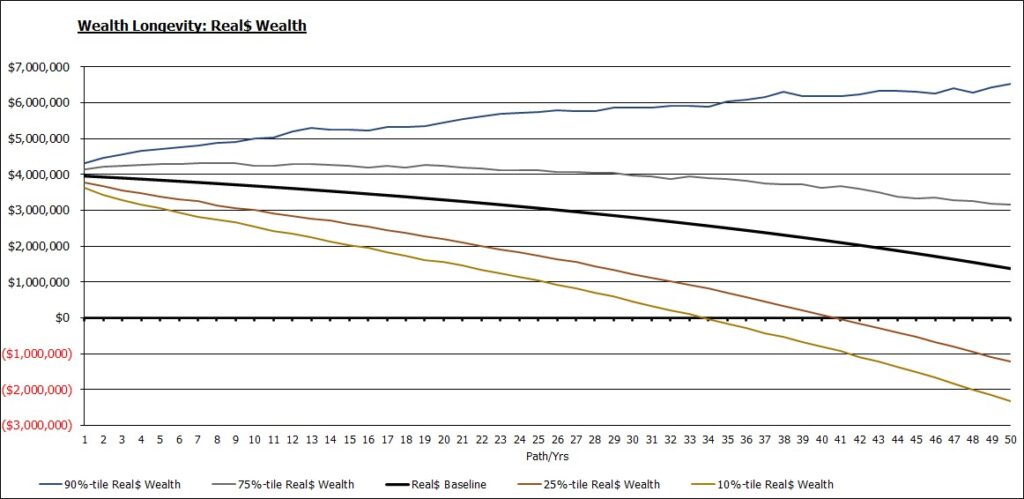
The real annual wealth chart adjusts the prior nominal annual wealth chart for inflation-adjusted purchasing power. As an e.g., baseline terminal nominal wealth, 50y out, of ~$4.7m translates to ~$1.4m on a real, inflation-adjusted, basis.
Probability of “wipeout” – outliving your wealth:
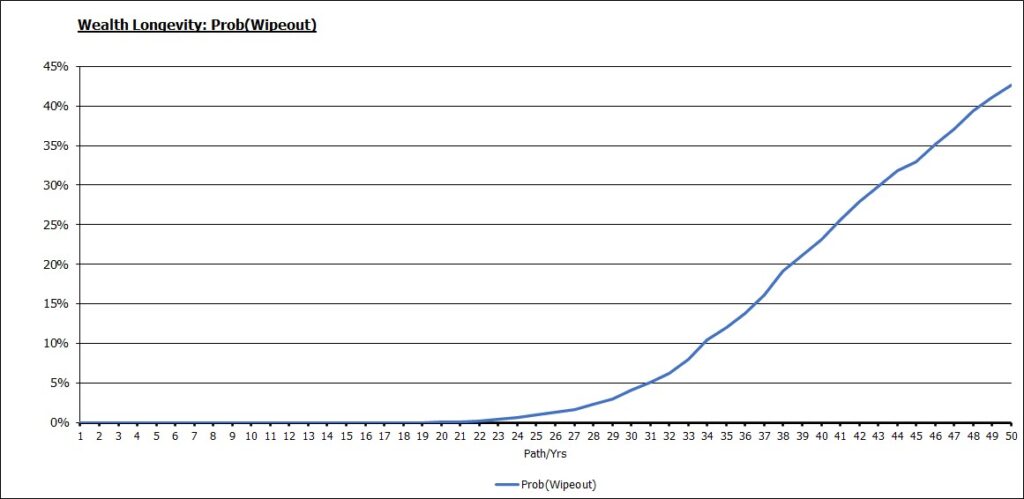
Given uncertain return and inflation outcomes, the above chart displays the likelihood, each year, of the % paths with negative wealth outcomes, i.e., the till running dry unable to support further spending. For instance, in year 35 there is approximately a 1 in 8 chance of wealth wipeout; by year 40 that escalates to approximately 1 in 4.
Probability of bequeathing real (inflation-adjusted) wealth legacy:
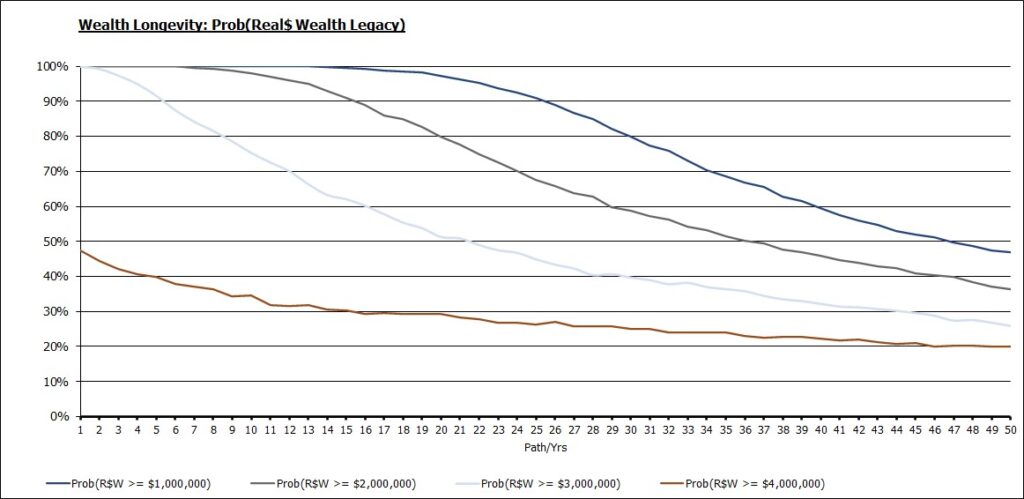
This final chart presents the likelihood, through time, of bestowing a real, inflation-adjusted, legacy i.e., leaving a purchasing-power adjusted nest egg for the next generation/entity of choice. For instance, the uppermost dark blue line depicts the probability of terminal wealth being at least $1m though time; until year 20 that is virtually certain, by year 35 that falls to ~70% and by year 40 that dips further to ~60%.
In summation, the only certainty regarding the cherished nirvana of retirement is uncertainty. Using multiple quantitative frameworks, tire-kicking the assumptions, and complementing them with qualitative guidelines and considerations, can help triangulate towards making a better informed and more thoughtful retirement decision. And, very finally, recognizing that models make wonderful servants, yet terrible masters, flexibility and dynamic adjustment are paramount. Enjoy the golden years!
Note: calculations Risk Advisors
Proprietary and confidential to Risk Advisors
