
Punch line: a stock-bond (price) correlation of 0.25 combined with a stock-bond risk premium of 4%, advocates a ~60% stock allocation (~40% bond allocation).
Optimal stock-bond allocation, in a mean-variance framework, is heavily dependent on the stock-bond correlation assumption which, as we’ve recently witnessed, is heavily regime dependent: both sign and magnitude.
In the classical duration/policy-driven regime, where inflationary dynamics are front and center, both stocks and bonds (prices) trade as +vely-correlated risk-reinforcing long-duration assets. This has been the standard regime largely prevalent until the Y2K dotcom implosion and now, once again, as inflationary dynamics have reasserted.
In the risk-premium/growth-flavored regime, where growth dynamics and protecting against the left tail-risk of deflation/disinflation are more pronounced, stocks and bonds trade as -vely correlated risk-diversifying assets. This has been the regime largely prevalent over the new millennia, until the most recent inflationary scare.
The following table shows the optimal stock allocation (bonds: 100% – stock allocation) for varying stock-bond correlation assumptions and differing stocks over bond excess-return expectations (risk premium), using a constrained mean-variance framework. While the absolute magnitude of the allocation is interesting, the relative changes in allocation across different scenarios is perhaps more instructive.
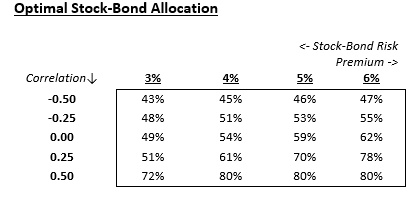
For instance, a stock-bond correlation of 0.25 combined with a stock-bond risk premium of 4%, advocates a 61% stock allocation (39% bond allocation).
The above analysis is based on the following broad assumptions: ST risk-free rate 2.25%; LT bond expected return 3.5%; stock vol 14% – 16%; bond vol 7.5% – 8.5%; min/max allocation: stocks 40%/80%, bonds 20%/60%;
Finally, please note the following, amongst other, caveats:
- optimization results are horribly unstable and one may arrive at vastly different solutions by varying time horizons and covariance matrices; additionally, they suffer from the “egg-crate” problem where slightly sub-optimal solutions may have more intuitively-appealing results
- this exercise is fraught with non-trivial noise and many moving parts and dimensions. Any quantitative analysis can at best serve as a starting-point suggestion designed to be qualitatively and dynamically modified, and at worst is dangerous science.
- this guidepost, along with other related analyses, may help triangulate towards an efficient allocation solution
- any such “rules” are designed to be broken and dynamically modified based on the evolving, situation-specific market environment
- prior research on macro asset-class-based mean-variance portfolios provides further detail on related methodology
Note: calculations Risk Advisors
Proprietary and confidential to Risk Advisors