Punch line: the recent market draw-down saw several fundamental factors and stylistic biases play a prominent role: risk, economic growth sensitivity, leveraged crowding, analyst buy recommendation and ST price momentum were shunned; earnings revision held its own.
October’s ghoulish fright saw the S&P 500 draw-down -9.9% (w/o dividends; Sept 20, 2018 – Oct 29, 2018). While higher long yields, a hawkish Fed, tighter financial conditions, peak margins, slowing growth expectations, trade tariff concerns et al, conspired to flavor the narrative, the following analysis investigates the role of fundamental factors and stylistic biases to the market downdraft.
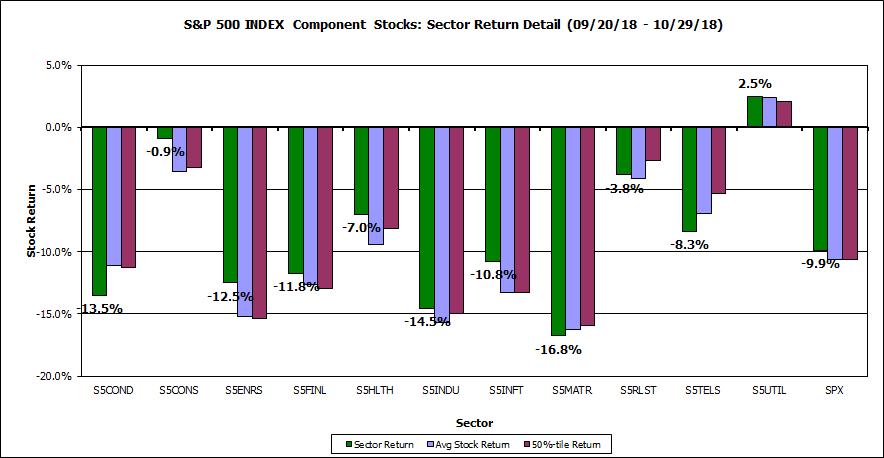
To set the stage, the following chart depicts the S&P 500 sector returns which reveal that sector returns were largely colored by cyclicality:
Next, I mapped the S&P 500 component stocks excess return (stock return – index return) along a variety of fundamental factors and stylistic biases (risk, valuation, price & earnings momentum, earnings revision, sentiment, leverage, profitability, crowding and economic growth) over this draw-down horizon.
I conducted the analysis in two different ways:
- equally-weighted top/bottom 20%-tile L/S portfolio performance bucketing by various factors/”alpha” generators
- correlation-decomposition & scatter-plot analysis across the entire body of the stocks return distribution
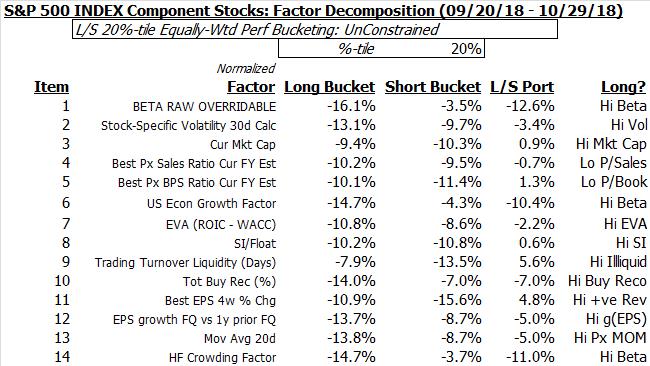
The following table summarizes the results using the top/bottom 20%-tile L/S portfolio on a sector-unconstrained basis:
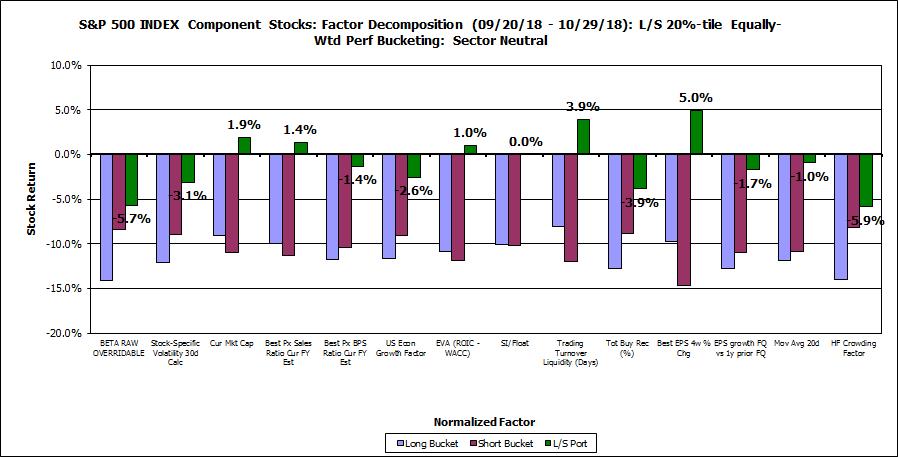
Somewhat similar results are gleaned using a sector-constrained analysis. This is shown below graphically:
Next, the second class of analysis: correlation-decomposition & scatter-plot analysis across the entire body of the stocks return distribution.
The table below lists, in declining order of absolute importance, the correlation between the component stock excess returns and major normalized fundamental factors and stylistic biases, along with the result of a multiple regression using all factors.
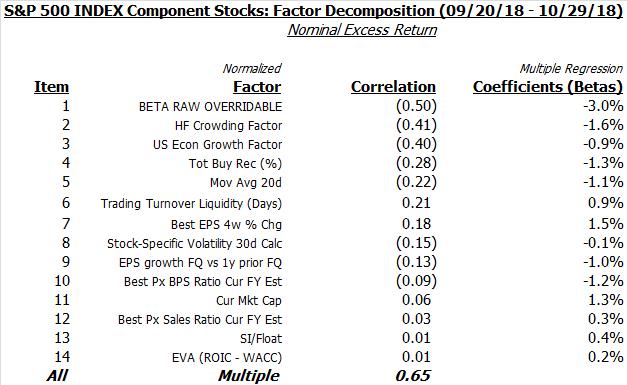
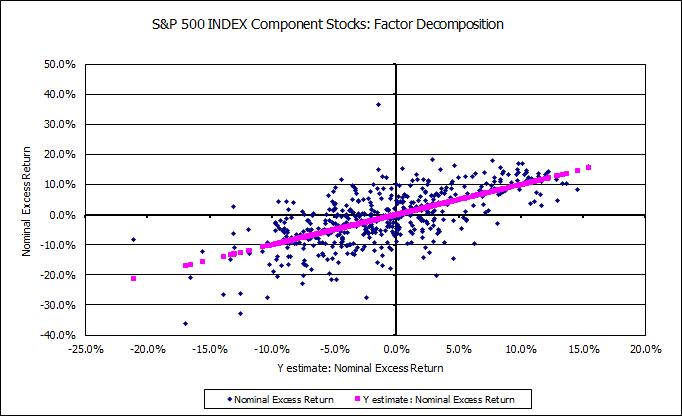
The result of the overall multiple regression using all factors is shown graphically below. The dispersion in the actual excess returns (blue dots) to the estimated excess returns (using the regression equation; pink dotted line) attest to the presence of significant stock-specific return elements, and/or other fundamental factors and stylistic biases not explored, after stripping away the effect of these common factors.
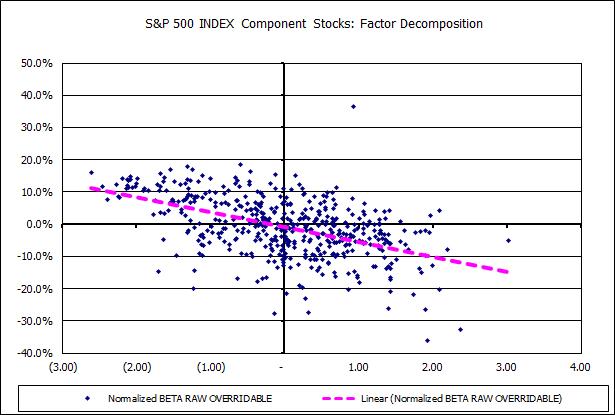
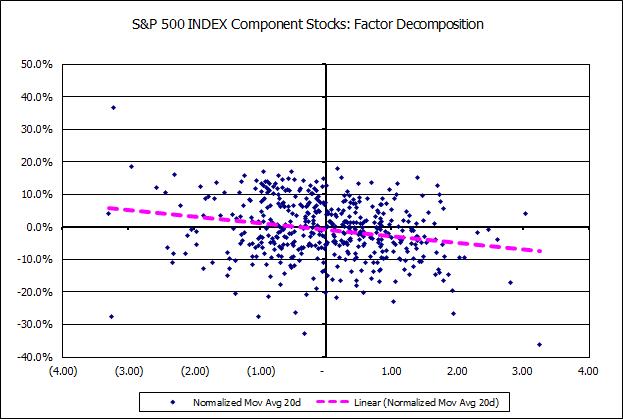
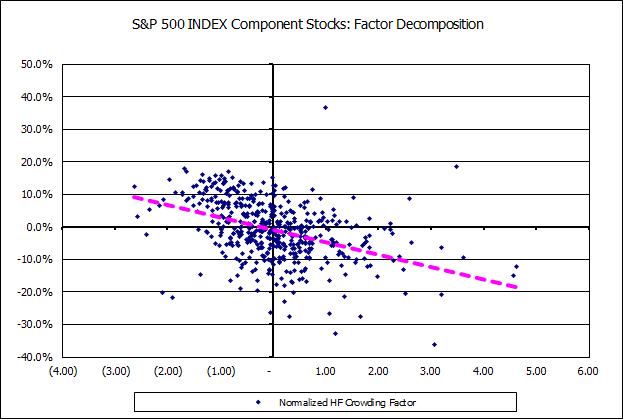
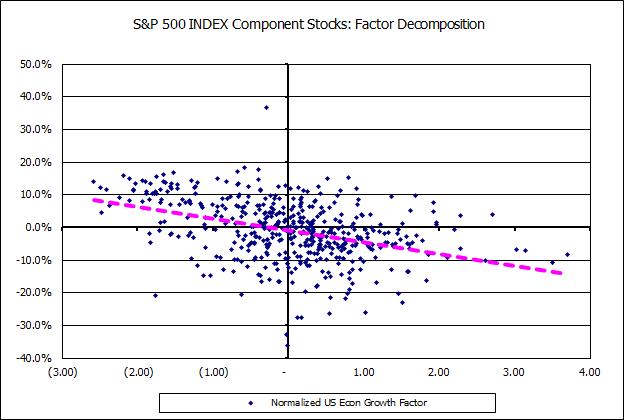
A few of the more interesting individual factor charts, considerable noise notwithstanding, follow. Note: all charts use component stock excess returns.
Traditional beta: high beta was shunned
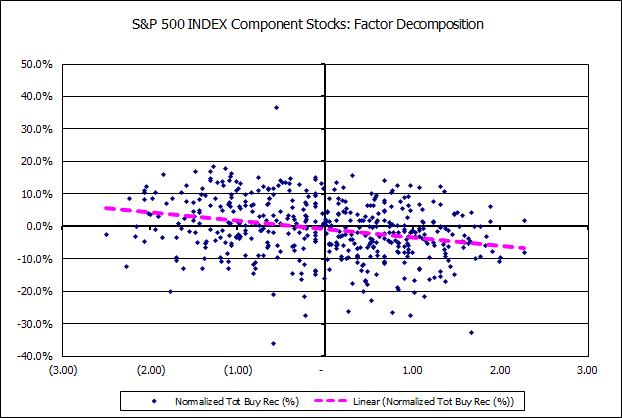
Analyst buy recommendation: market-darlings under-performed
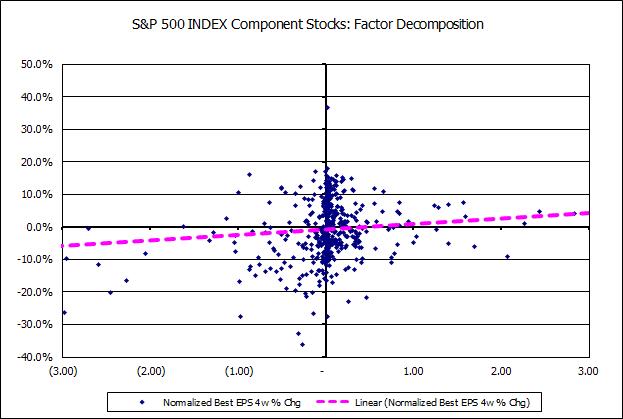
Earnings revision: +ve earnings revision was rewarded
ST price momentum: near-term momentum stocks mean reverted
Hedge-fund crowding: deleveraging reigned
US Economic growth sensitivity: performance was inversely proportional to cyclicality
In summation, while there are a variety of robust ways to perform this class of analysis (principal component decomposition, factor analysis etc.), these two analyses – performance-bucketing by “alpha” generators and correlation-decomposition & scatter-plot representation – quite vividly portray stock-return dependence/independence on major fundamental factors and stylistic biases.
Finally, in the spirit of a caveat, as in prior market about-faces, current winning/losing factors are often susceptible to abrupt reversal should the market factor and style complexion change direction.
Note: calculations Risk Advisors, data Bloomberg
Proprietary and confidential to Risk Advisors
