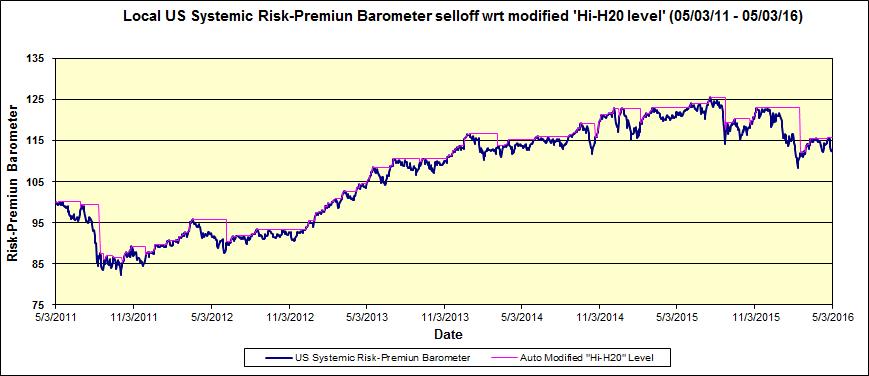
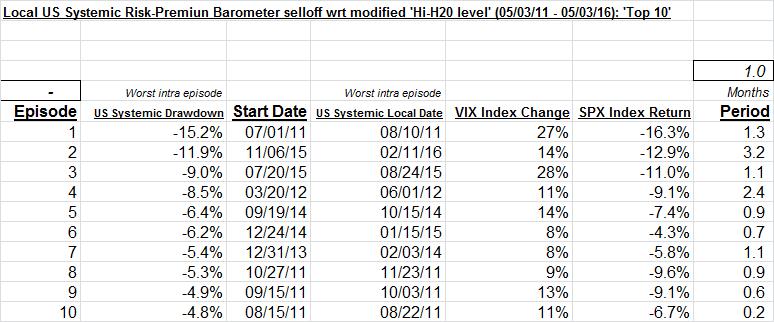
Punch line: given the recent episodes of systemic fragility in risky assets and as we enter the “sell in May and go away” time zone, I created a US cross asset-class risk-premium barometer to gauge the potential for risky-asset vulnerability. Shown are the macro asset-class and SPX industry response within extreme selloff episodes of the systemic risk-premium barometer; the message largely hues to intuition with the magnitude of the industry response colored by cyclicality.
Given the recent episodes of systemic fragility in risky assets (summer 2015 and winter 2015/16) and as we enter the “sell in May and go away” time zone, I created a US cross asset-class risk-premium barometer (trailing 5y; subject to a modified high-water mark) to gauge the potential for risky-asset vulnerability. The pdfs below enumerate macro asset-class and SPX industry response within extreme selloff episodes of the systemic risk-premium barometer which includes: equities (SPX), volatility (VIX), rates (UST5y), credit (HY CDS), currency (JPY) and commodity (gold). In the spirit of extreme systemic distress, I only selected the 10 worst episodes, harvested from the chart below, and reflected in the table following.


Shown are the return/change statistics for a variety of macro asset classes and SPX industries, along with median and hit-rate metrics. The message largely hues to intuition with the magnitude of the industry response colored by cyclicality.
US systemic risk-premium baromoter selloff episodes MACRO PDF
US systemic risk-premium baromoter selloff episodes INDUSTRY PDF
Note: calculations Risk Advisors, data Bloomberg
Proprietary and confidential to Risk Advisors
