
Punch line: the current “FANG” out-performance falls shy of the pace and magnitude recorded during this stage of their epic 2015 run.
Give the current hype surrounding “FANG” stocks (FB, AMZN, NFLX, GOOGL) I revisited an earlier expose, “Anatomy of a crowded stock,” which illustrated the 2015 relative performance of FANG stocks as a poster-child specimen of the life-cycle dynamics of crowding. The 2015 cumulative abnormal return (“CAR”; summation of daily beta-adjusted excess return; Jan 20, 2015 – Feb 5, 2016) of FANG stocks is depicted in the chart below (lighter dashed line is current YTD CAR):
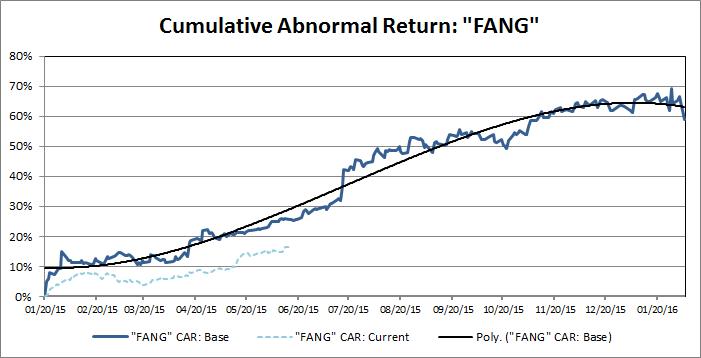
Next, I superimposed the current CAR of FANG stocks, component and aggregate, around the fitted value of their 2015 CAR, which serves as a baseline boundary threshold, to help contextualize their YTD out-performance. Inter-temporal relative-valuation dynamics notwithstanding, the current FANG out-performance falls shy of the pace and magnitude recorded during this stage of their epic 2015 run; this is reflected in the graph above and in the left-panel charts in the pdf link below. The right-panel charts telescope more granularly into their YTD CAR.
Shown between the charts is the recent CAR trend (trailing 5d, 10d, 15d, 20d & 25d) to transmit second-order CAR behavior and, at the risk of transmitting false signals, a qualitative signaling label based on the recent ST CAR trend (using a rules-based algorithm to quantify the qualitative labeling process).
FANG redux pdf
Finally, as a caveat, it is important to note that these are highly noisy processes with the potential for false-signal whipsaw and with the magnitude and horizon/phase length subject to tremendous variability; the analogy might be RSIs which can stay extended for long periods of time with the magnitude of subsequent mean reversion quite uncertain.
Note: calculations Risk Advisors, data Bloomberg
Proprietary and confidential to Risk Advisors