
Punch line: EM FX and EM vs. DM equity relative performance move concordantly particularly once the date-alignment constraint is loosened. Drilling down to EM sector performance, sector relative performance is colored by cyclicality during extreme EM FX selloff and rally episodes.
Following up on the recent Dollar and EM: redux post, the below analysis studies the EM vs. DM equity (MSCI EM local* vs. S&P 500) relative-performance dynamics set against the backdrop of EM FX (MSCI EM currency).
To paraphrase the earlier conclusion: while extreme dollar (DXY) selloffs don’t unambiguously foretell EM equity out-performance, extreme DXY rallies have virtually always been associated with EM equity under-performance, over this recent sample period.
On the flip side, one might hypothesize that EM FX and EM vs. DM equity relative performance move concordantly, particularly for significant moves in EM FX; that is the topic of this study.
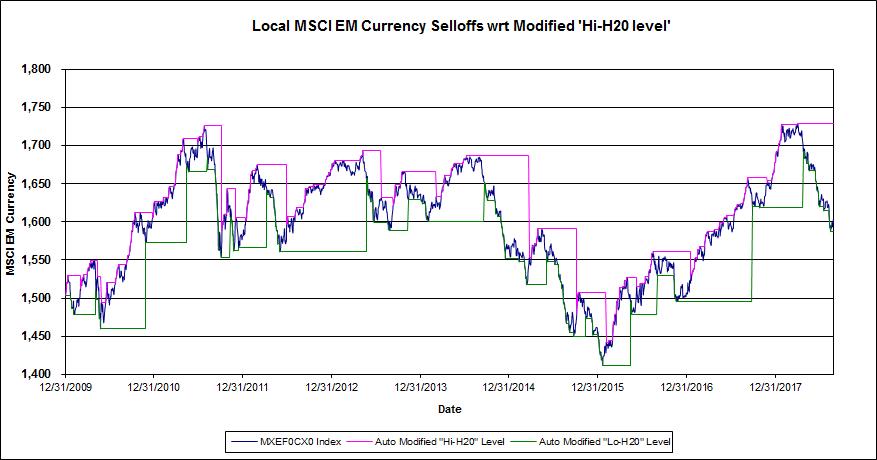
To set the stage, I selected the top 15 EM FX selloff/rally episodes, subject to a modified high/low-water mark, harvested from the chart below (Jan 1, 2010 to date; post GFC draw-down and aftermath):
In order to test the concordant EM FX to EM/DM equity relative-performance hypothesis, I looked at the MSCI EM local vs. S&P500 relative return over these extreme EM FX episodes. This is reflected in the chart below:
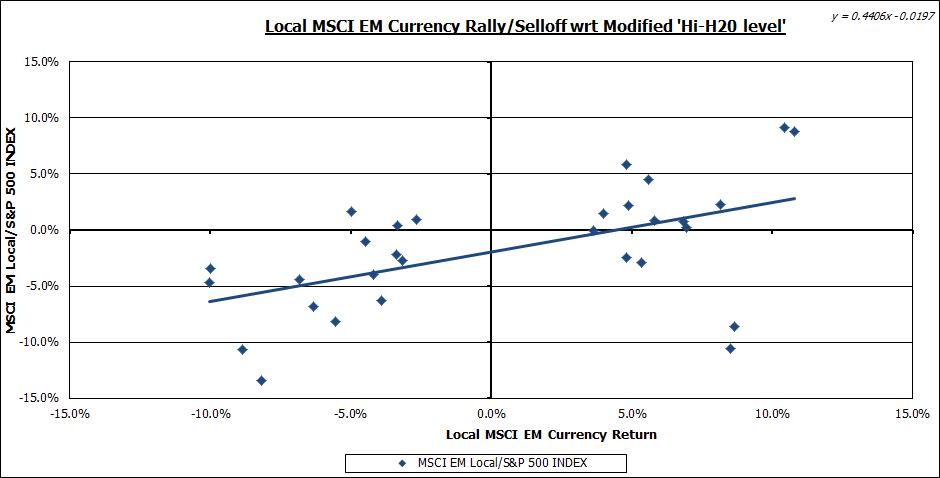
While the slope of the trend line affirms intuition, the noise in the data is somewhat surprising, particularly considering that these represent significant EM FX episodes, as one might have expected more vigorous concomitant EM/DM equity relative performance.
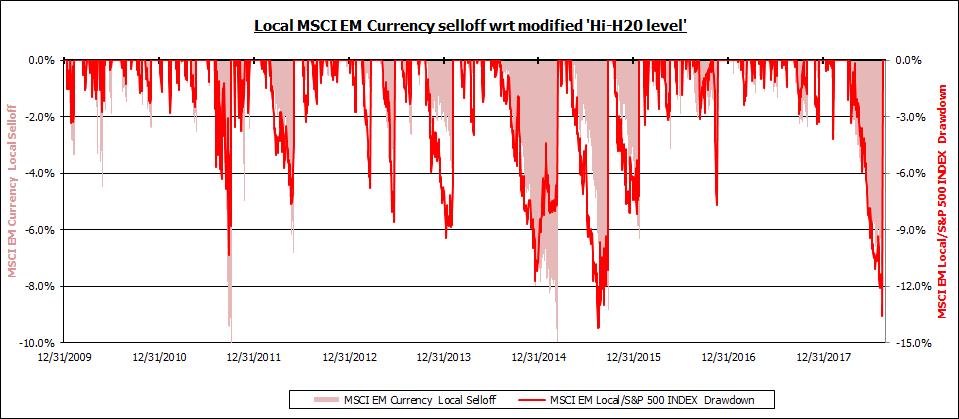
However, recognizing that the above EM/DM equity relative returns are over discreet EM FX calendar windows and, more often than not, the max EM/DM equity relative performance does not occur concurrently with the local EM FX episode date bookends, I combed through each EM FX extreme episode to tease out the max intra-episode EM/DM equity relative-return (scenario-generation mechanics described below**).
The chart below depicts the EM FX and EM/DM equity relative-return evolution over selloff episodes (left y-axis: EM FX – pink block; right y-axis: EM/DM equity relative return – red line; note: differential scale of y-axes):
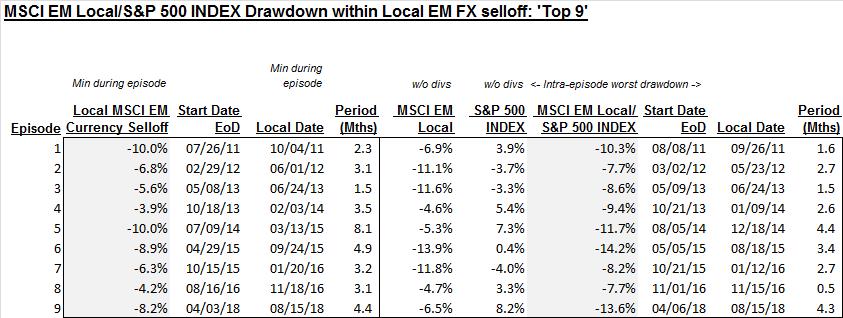
Further, I only selected extreme EM FX-contingent episodes where the EM/DM equity relative-return drawdown was <= -4.5% and EM FX selloff was <= -3.5%; this yielded 9 extreme joint episodes, shown below:
Rounding out, the below pdf enumerates the intra-period MSCI EM local sector response, ranked best to worst, within extreme EM FX selloff episodes. As the scenarios are quite disparate it may be more meaningful to focus on environmentally-pertinent episodes.
Episodic EM sector perf vs. EM FX selloff
Repeating the above analyses for the EM FX significant-rally quadrant:
First, the chart below depicts the EM FX and EM/DM equity relative-return evolution over rally episodes (left y-axis: EM FX – mint-green block; right y-axis: EM/DM equity relative return – green line; note: differential scale of y-axes):
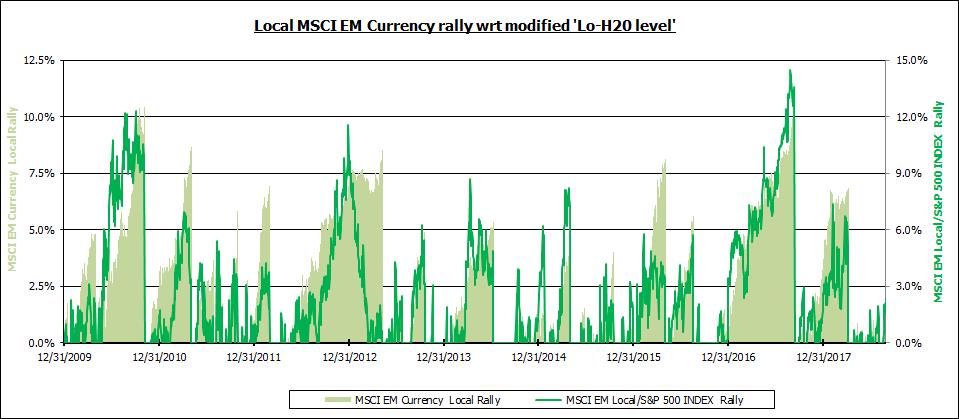
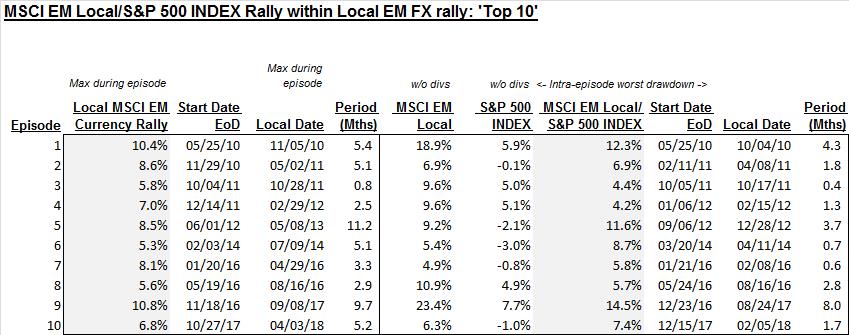
Further, I only selected extreme EM FX-contingent episodes where the EM/DM equity relative-return rally was >= 4% and EM FX rally was >= 5%; this yielded 10 extreme joint episodes, shown below:
Rounding out, the below pdf enumerates the intra-period MSCI EM local sector response, ranked best to worst, within extreme EM FX rally episodes. As the scenarios are quite disparate it may be more meaningful to focus on environmentally-pertinent episodes.
Episodic EM sector perf vs. EM FX rally
* EM equity returns, index and sector, are underlying local-currency equity returns
**To illustrate the episode-generation process consider the following e.g.: local EM FX rally episode (10/27/17 – 04/03/18): 6.8%; max intra-episode EM/DM equity relative-return rally (12/15/17 – 02/05/18): 7.4%. Since EM/DM equity relative-return was >= 4% and EM FX rally was >= 5%, this represents a joint extreme-episode scenario.
Note: calculations Risk Advisors, data Bloomberg
Proprietary and confidential to Risk Advisors