
Punch line: Q3, 2018 witnessed a buoyant stock market led by out-sized gains in healthcare. Intra-sector stock-returns were differentially dispersed: wider idiosyncratic-driven groupings in a few sectors and tighter macro-tinged groupings in others. These risk-return outcomes are reflected in the charts and tables below.
The following is an update of the quarterly sector-level dispersion analysis which reveals an ebullient market, positively-dispersed sector returns, led by healthcare, and varied intra-sector dispersion outcomes:
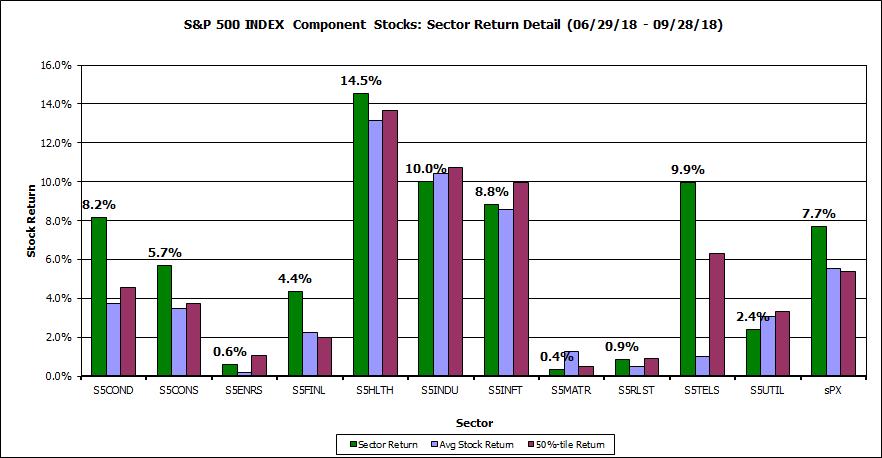
This first chart notes the sector (cap-weighted) return (green bars), average (equally-weighted) return (blue bars) and median stock return (burgundy bars) for the various sector of the S&P 500 over the Q3, 2018 horizon (with dividends, latest constituents). Sector returns were all positive, a few grudgingly so, led by out-sized gains in healthcare. For most sectors, save industrials, materials and utilities, cap-weighted returns bested equally-weighted returns reflecting large-cap out-performance in the S&P 500 sector space.
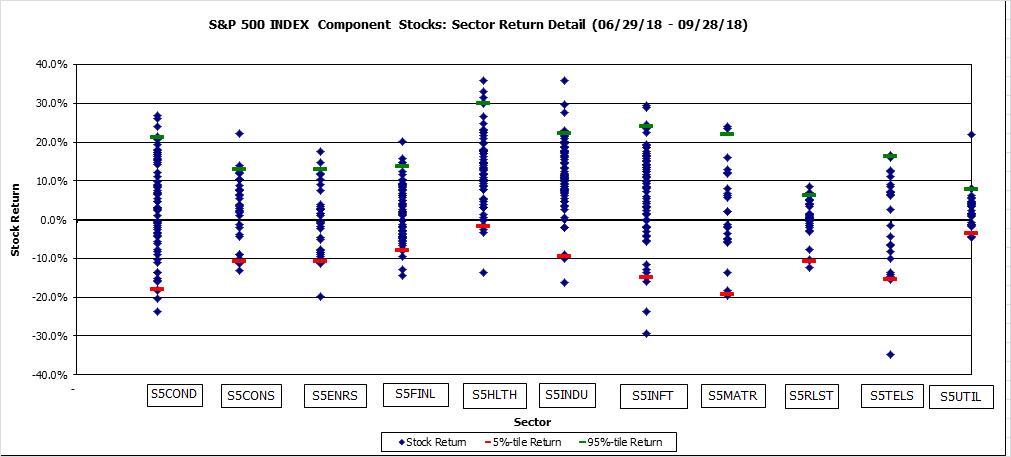
Next, a scatter plot of stock returns by sector, along with 5%- & 95%-tile markers (save scale-perverting AMD at 106.1%). Intra-sector stock-returns, relative to their volatility, were well dispersed in a few sectors including info tech, materials and consumer discretionary and sported relatively tighter macro-tinged groupings in several sectors including energy, financials, real estate and utilities. This is visually apparent in the chart below and more precisely in the table that follows.
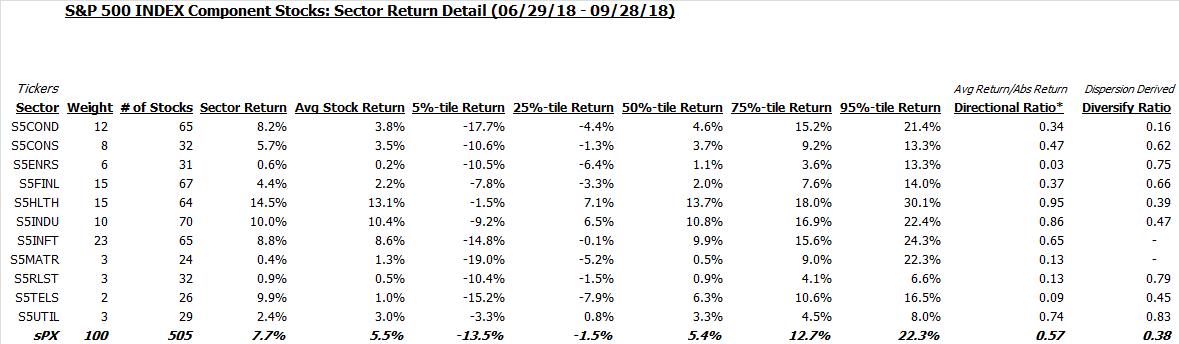
This is also shown in tabular form along with the %-tile sector return distribution. Also shown is the directional ratio (avg net return to avg gross return) and dispersion-based diversification ratio (index vol/component vol), which points to differentially dispersed intra-sector outcomes.
Finally, a listing of stock returns, by sector, ranked in descending order of performance is shown in the below pdf:
Stock by sector returns Q3, 2018
And, very finally, the cumulative abnormal return (“CAR”; summation of daily beta-adjusted excess return) of the S&P 500 GICS industries, over the Q3, 2018 horizon. I ran the CAR for each S&P 500 industry, sorted them in order of out-performance, and then charted the top 10/bottom 10 CAR industries in the below pdfs:
Note: calculations Risk Advisors, data Bloomberg
Proprietary and confidential to Risk Advisors